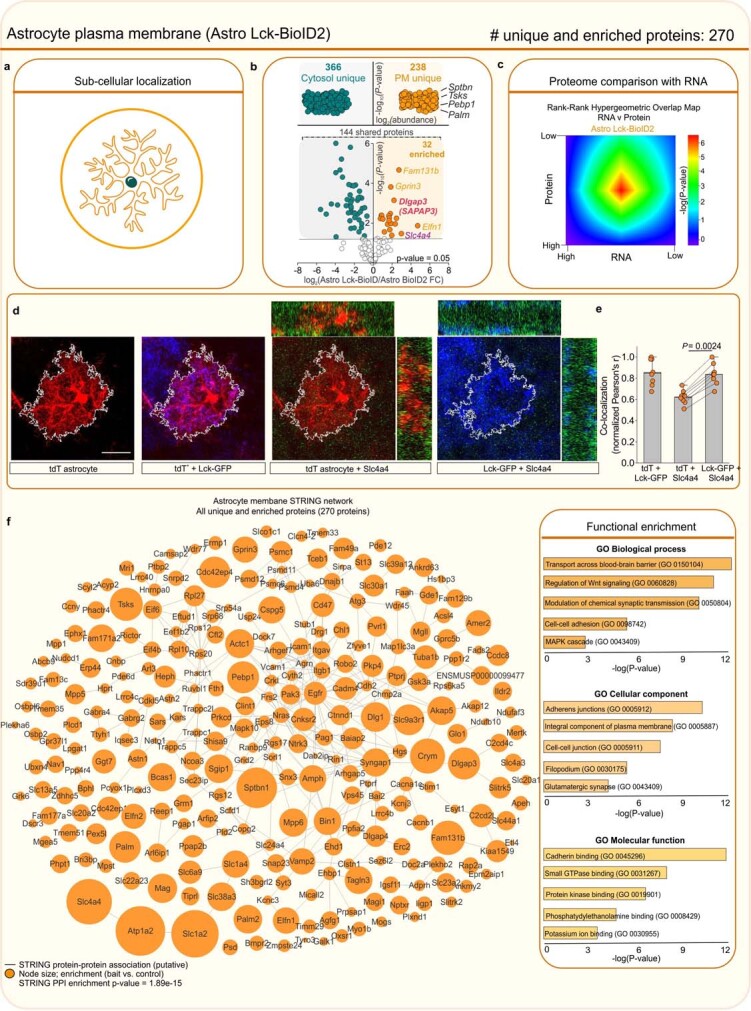
Extended Data Fig. 11. Astrocyte subcompartment card 1: plasma membrane.

a. BioID2 that is targeted to the plasma membrane biotinylates proteins near the plasma membrane. b. Label-free based quantification comparison of significant proteins (Log2FC > 1 and FDR < 0.05 versus GFP controls) detected in the cytosolic Astro BioID2 and plasma membrane Astro Lck-BioID2 reveal plasma membrane enriched proteins. Top half of the volcano plot shows 238 unique Lck-BioID2 proteins when compared to cytosol. The top four most abundant proteins for Lck-BioID2 are shown. Lower half of volcano plot shows comparison of 144 proteins that were common in both cytosolic BioID2 and Lck-BioID2. The five highest enriched proteins for Lck-BioID2 (Log2FC > 2) are shown. Magenta label shows protein that was validated with IHC in panel d. Red label shows Dlgap3/SAPAP3 is enriched in the astrocyte plasma membrane. c. Heat map shows the rank-rank hypergeometric overlap (RRHO) of the RNA and protein rank for the 270 plasma membrane proteins. Each pixel represents the significance of overlap between the two datasets in –log10(P-value). Red pixels represent highly significant overlap. Color scale denotes the range of P-values at the negative log10 scale (bin size = 100). d. IHC analysis of Slc4a4 (Nbc1) protein in tdTomato and Lck-GFP labeled astrocytes shows co-localization within the astrocyte territory. Scale bar represents 20 μm. e. Co-localization analysis using Pearson’s r co-efficient shows high co-localization between Lck-GFP and Slc4a4 (Nbc1). The mean and SEM are shown (n = 8 tdTomato+ cells from 4 mice; Two-tailed paired t-test). f. Scale-free STRING analysis protein-protein association map of the 270 unique and enriched biotinylated proteins identified in astrocyte plasma membrane with Astro Lck-BioID2 . Node size represents the enrichment of each protein vs the GFP control (log2(BioID2/GFP)). Edges represent putative interactions from the STRING database. Bar graphs show the functional enrichment analysis of the 270 proteins using “Biological process”, “Cellular component”, and “Molecular function” terms from Enrichr.
