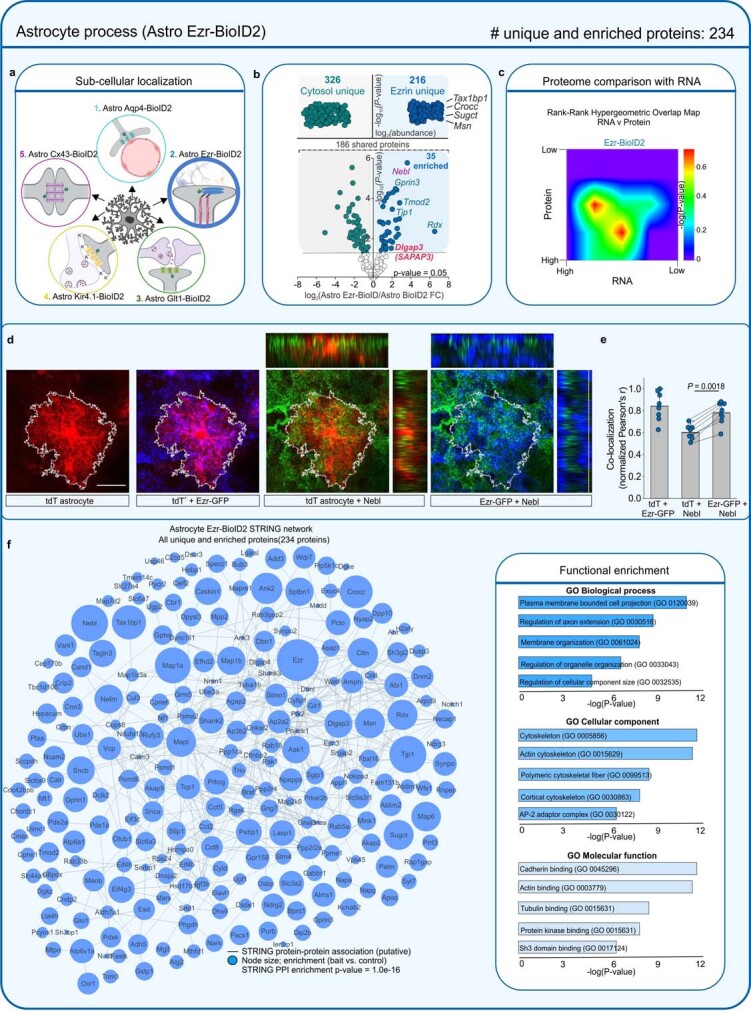
Extended Data Fig. 13. Astrocyte subcompartment card 3: astrocyte processes.

a. BioID2 that is targeted with Ezr-BioID2 biotinylates proteins at astrocyte processes. b. Label-free based quantification comparison of significant proteins (Log2FC > 1 and FDR < 0.05 versus GFP controls) detected in the cytosolic Astro BioID2 and fine process Astro Ezrin-BioID2 reveal fine process enriched proteins. Top half of the volcano plot shows 216 unique Ezrin-BioID2 proteins when compared to cytosol. The top four most abundant proteins for Ezrin-BioID2 are shown. Lower half of volcano plot shows comparison of 186 proteins that were common in both cytosolic BioID2 and Ezrin-BioID2. The five highest enriched proteins for Ezrin-BioID2 (Log2FC > 2) are shown. Magenta label shows protein that was validated with immunohistochemistry in panel d. Red label shows Dlgap3/SAPAP3 is enriched in the astrocyte fine processes. c. Heat map shows the rank-rank hypergeometric overlap (RRHO) of the RNA and protein rank for the 234 Ezr-BioID2 proteins. Each pixel represents the significance of overlap between the two datasets in –log10(P-value). Red pixels represent highly significant overlap. Color scale denotes the range of P-values at the negative log10 scale (bin size = 100). d. IHC analysis of Nebl protein in tdTomato and Ezr-GFP labeled astrocytes shows co-localization within the astrocyte territory. Scale bar represents 20 μm. e. Co-localization analysis using Pearson’s r co-efficient shows high co-localization between Ezr-GFP and Nebl. The mean and SEM are shown (n = 8 tdTomato+ cells from 4 mice; Two-tailed paired t-test). f. Scale-free STRING analysis protein-protein association map of the 234 unique and enriched biotinylated proteins identified in astrocyte processes with Astro Ezr-BioID2 . Node size represents the enrichment of each protein vs the GFP control (log2(BioID2/GFP)). Edges represent putative interactions from the STRING database. Bar graphs show the functional enrichment analysis of the 234 proteins using “Biological process”, “Cellular component”, and “Molecular function” terms from Enrichr. The image of the astrocyte subcompartments in panel a was created using BioRender (https://www.biorender.com/).
