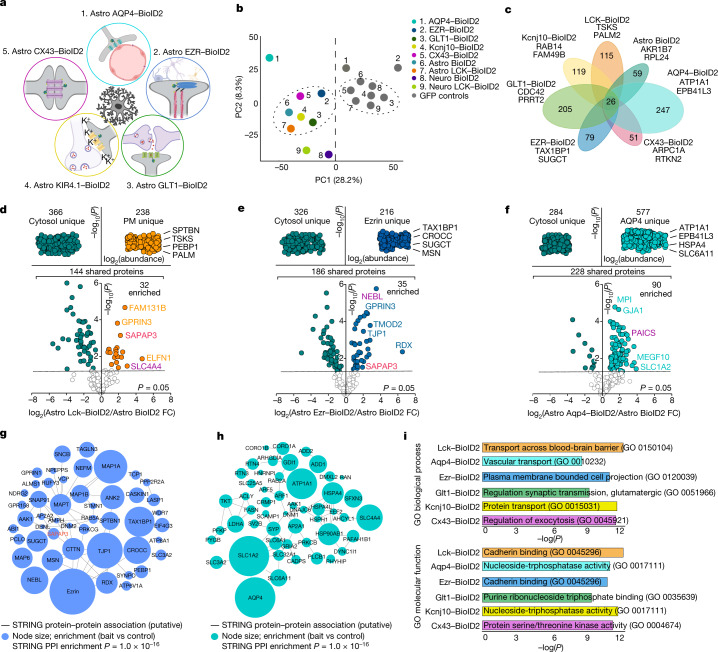
Fig. 2. Striatal astrocyte subcompartment proteomes.
a, Cartoon illustrating the five astrocyte subcompartments targeted genetically with BioID2. b, PCA plot of the average of all proteins identified in each BioID2 construct. Points represent the mean for each construct (n = 4 technical runs consisting of 8 mice each per construct). c, Clustergram depicting the unique number of proteins detected in each subcompartment-specific BioID2 experiment. All proteins hereafter represent those that were significant (log2FC > 1 and FDR < 0.05 versus GFP controls). The top two most abundant proteins for each subcompartment are named. d, Label-free based quantification comparison of proteins detected in the cytosolic Astro BioID2 and PM Astro LCK–BioID2. Top, specific LCK–BioID2 proteins compared to cytosol. The top four most abundant proteins for LCK–BioID2 are indicated. Bottom, volcano plot comparing proteins that were shared in both cytosolic BioID2 and LCK–BioID2. The five highest enriched proteins for LCK–BioID2 (log2(FC) > 2) are indicated. Magenta label shows protein that was validated by IHC in Extended Data Fig. 11. Red label shows that SAPAP3 is enriched in the astrocyte PM. e,f, As in d but for cytosolic Astro BioID2 and Astro EZR–BioID2 (e) and cytosolic Astro BioID2 and Astro AQP4–BioID2 (f). g, STRING analysis map of the top 50 (by LFQ abundance) biotinylated proteins identified in astrocyte fine processes with Astro EZR–BioID2. Node size represents the enrichment of each protein versus the GFP control. Edges represent putative interactions from the STRING database. h, As in g but for proteins identified in the astrocyte end foot with Astro AQP4–BioID2. i, Bars show the most significant Enrichr gene ontology (GO) term for the unique and enriched proteins found in each astrocyte subcompartment. Top, the GO term for biological process. Bottom, the GO term for molecular function.

