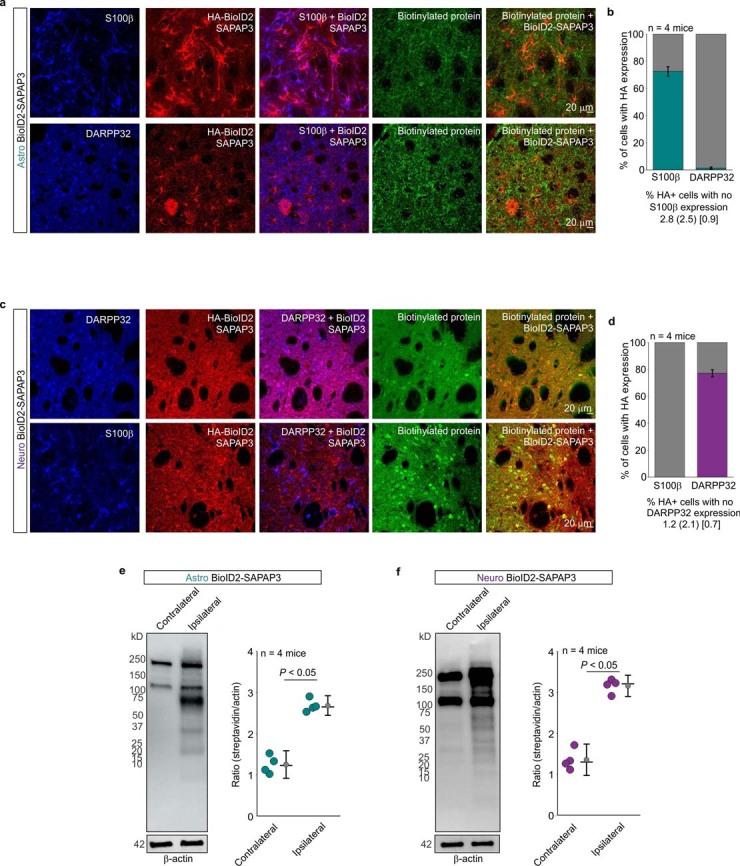
Extended Data Fig. 17. IHC and Western blots for SAPAP3 BioID2 constructs.

a. Representative images of immunostained mouse striatum injected with astrocyte-specific BioID2-SAPAP3 and then treated with biotin for 7 days. Top panel shows the immunostaining pattern with S100β as an astrocyte cell marker and bottom panel shows the immunostaining pattern with DARPP32 as a neuronal cell marker. b. Bar graphs depicting the percent of S100β positive or DARPP32 positive cells with HA expression in a 40x magnification field of view. Teal portion of the bar graphs show the percent co-localization. Bottom descriptive statistics represent percent of HA+ cells that were not S100β positive as the mean (SD) [SEM] (n = 8 fields of view at 40x magnification from 4 mice). c. Representative images of immunostained mouse striatum injected with neuron-specific BioID2-SAPAP3 and then treated with biotin for 7 days. Top panel shows the immunostaining pattern with DARPP32 as a neuronal cell marker and bottom panel shows the immunostaining pattern with S100β as an astrocyte cell marker. d. Bar graphs depicting the percent of S100β positive or DARPP32 positive cells with HA expression in a 40x magnification field of view. Purple portion of the bar graphs show the percent co-localization. Bottom descriptive statistics represent percent of HA+ cells that were not DARPP32 positive as the mean (SD) [SEM] (n = 8 fields of view at 40x magnification from 4 mice) e. Western blot analysis of brain unilaterally microinjected with astrocyte specific BioID2-SAPAP3. Dark bands at 130 kD and 250 kD show the endogenously biotinylated mitochondrial proteins, pyruvate carboxylase and acetyl-CoA carboxylase. Graph depicting the streptavidin signal intensity divided by the β-actin signal intensity for each data point. Black horizontal line depicts the mean, circle represents the median, and error bars show the SEM (n = 4 mice; Two-tailed Mann-Whitney Test, P = 0.029). f. Western blot analysis of brain unilaterally microinjected with neuron specific BioID2-SAPAP3. Graph depicting the streptavidin signal intensity divided by the β-actin signal intensity for each data point. Black horizontal line depicts the mean, circle represents the median, and error bars show the SEM (n = 4 mice; Two-tailed Mann-Whitney Test, P = 0.014). For blot source data, see Supplementary Fig. 1.
