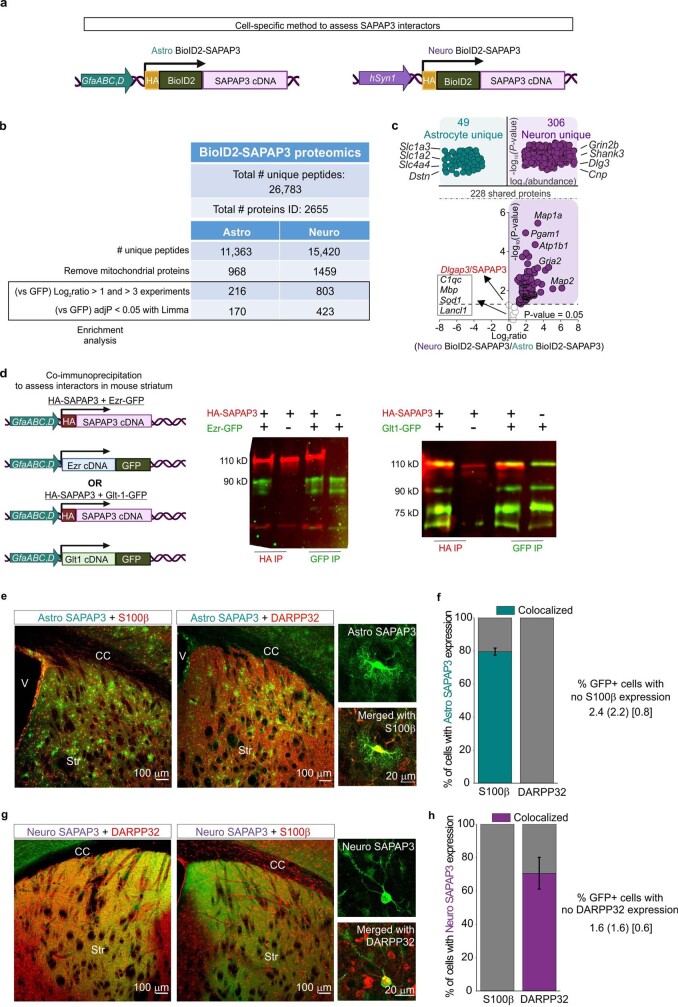
Extended Data Fig. 18. Assessment of cell-specific interactors of SAPAP3 in astrocytes using BioID2 proteomics.
a. Schematic of cell-specific BioID2 fused to SAPAP3 used in the AAV constructs. b. Table shows the number of peptides and proteins found in the cell-specific BioID2-SAPAP3 proteomics experiments. Each row shows the number of proteins after filtering. c. Label-free based quantification comparison of significant proteins (Log2FC > 1 and FDR < 0.05 versus GFP controls) detected in the Astro BioID2-SAPAP3 and Neuro BioID2-SAPAP3 reveal unique astrocyte and neuron SAPAP3 interactors. Top half of the volcano plot shows 306 unique Neuro BioID2-SAPAP3 proteins and 49 unique Astro BioID2-SAPAP3 proteins when compared to each other. The top four most abundant proteins for each cell type are shown. Lower half of volcano plot shows comparison of 228 proteins that were common in both Astro BioID2-SAPAP3 and Neuro BioID2-SAPAP3. The five highest enriched proteins (Log2FC > 2) for neurons are shown. Proteins that did not pass the enrichment threshold for either cell type are represented in the gray box. d. Schematic shows astrocyte specific HA tagged SAPAP3, GFP fused Ezrin, and GFP fused Glt-1 used in AAV constructs to assess interactions via co-immunoprecipitation. 16 week old wild type mice were injected in the striatum with one of the following combinations: HA-SAPAP3 + Ezr-GFP, HA-SAPAP3 + Glt-1-GFP, HA-SAPAP3 only, Ezr-GFP only, or Glt1-GFP only. Western blot shows the immunoprecipitation of either HA or GFP after protein complex isolation. The band 110 kD represents the HA-SAPAP3 band, while the 90 kD bands represent Ezrin-GFP (93 kD) or Glt1-GFP (92 kD). n = 4 mice per combination, 3 technical replicates. e. Representative images of immunostained mouse striatum injected with astrocyte-specific GFP-SAPAP3 (Astro SAPAP3). Left panel shows the immunostaining pattern with S100β as an astrocyte cell marker and right panel shows the immunostaining pattern with DARPP32 as a neuron cell marker. f. Bar graphs depicting the percent of S100β positive or NeuN positive cells with HA expression in a 20x magnification field of view. Teal portion of the bar graphs show the percent co-localization. Bottom descriptive statistics represent percent of HA+ cells that were not S100β positive as the mean (SD) [SEM] (n = 8 fields of view at 20x magnification from 4 mice) c. Representative images of immunostained mouse striatum injected with astrocyte-specific GFP-SAPAP3 (Astro SAPAP3). Left panel shows the immunostaining pattern with S100β as an astrocyte cell marker and right panel shows the immunostaining pattern with DARPP32 as a neuron cell marker. g. Representative images of immunostained mouse striatum injected with neuron-specific GFP-SAPAP3 (Neuro SAPAP3). Left panel shows the immunostaining pattern with DARPP32 as a neuron cell marker and right panel shows the immunostaining pattern with S100β as an astrocyte cell marker. h. Bar graphs depicting the percent of S100β positive or NeuN positive cells with HA expression in a 20x magnification field of view. Purple portion of the bar graphs show the percent co-localization. Bottom descriptive statistics represent percent of HA+ cells that were not DARPP32 positive as the mean (SD) [SEM] (n = 8 fields of view at 20x magnification from 4 mice). The image of the DNA constructs in panels a and d was created using BioRender (https://www.biorender.com/).

