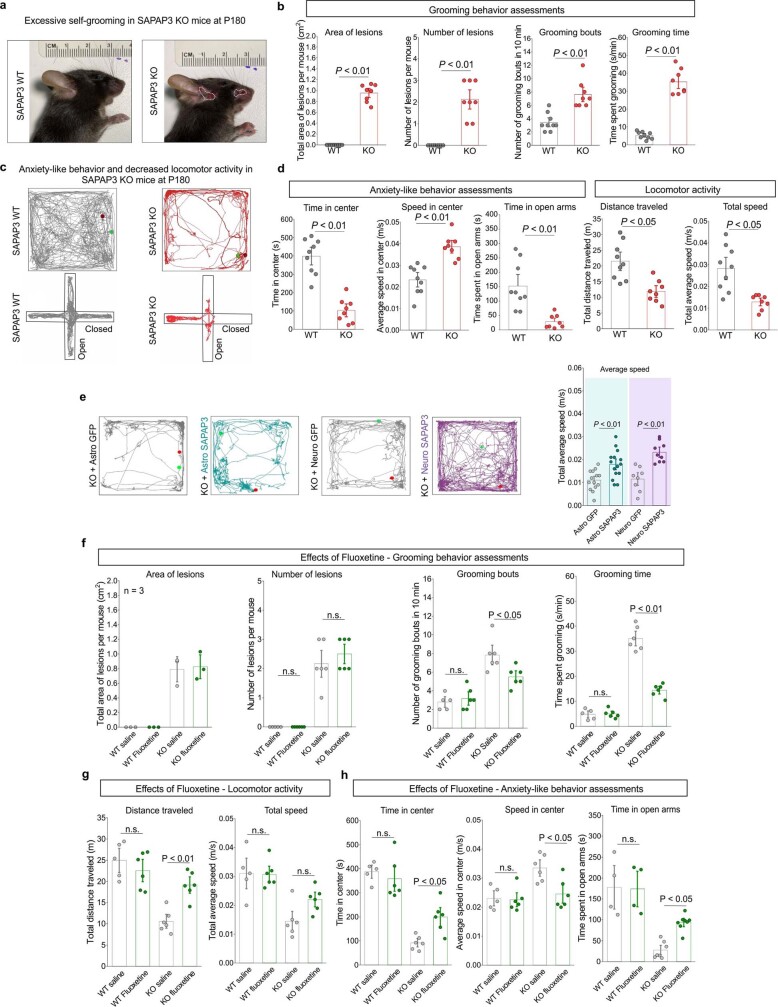
Extended Data Fig. 19. Behavior of SAPAP3 WT, KO, and fluoxetine treated mice.
a. Representative photographs of SAPAP WT and SAPAP3 KO mice at P180. White outline shows the border of each lesion. b. Bar graphs show assessment of grooming behavior in SAPAP3 WT and SAPAP3 KO by four different metrics: area of open lesions, number of lesions, grooming bouts, and time spent grooming. n = 9 for the SAPAP3 WT mice and n = 8 for the SAPAP3 KO mice. The mean and SEM are shown (area of open lesions: WT v KO, two-tailed one sample t-test, P < 0.001 ; number of lesions per mouse: WT v KO, two-tailed one sample t-test, P = 0.002; number of grooming bouts: WT v KO, two-tailed Mann-Whitney test, P = 0.009; time spent grooming: WT v KO, two-tailed unpaired t-test with Welch correction, P < 0.001). c. Representative traces of 20 min open field recordings for SAPAP3 WT and SAPAP3 KO mice at P180. Green dot depicts the location of the mouse at the start of the recording, while the red dot depicts the location of the mouse at the end of the recording. The center of the open field was 2.5 cm from the boundary wall. Bottom panels show representative traces of 10 min elevated plus maze recordings for SAPAP3 WT and SAPAP3 KO mice at P180. Green dot depicts the location of the mouse at the start of the recording, while the red dot depicts the location of the mouse at the end of the recording. d. Bar graphs show anxiety-like behavior and locomotor activity in SAPAP3 WT and SAPAP3 KO mice by four different metrics: time in center of the open field, speed in center of the open field, time spent in open arms of the elevated plus maze, total distance traveled, and total average speed. n = 9 for the SAPAP3 WT mice and n = 8 for the SAPAP3 KO mice. Mean and SEM are shown (time in center: WT v KO, two-tailed unpaired t-test with Welch correction, P < 0.001; speed in center: WT v KO, two-tailed unpaired t-test with Welch correction, P = 0.001; time in open arms: WT v KO, two-tailed unpaired t-test with Welch correction, P = 0.002; distance traveled: WT v KO, two-tailed unpaired t-test with Welch correction, P = 0.001; average speed: WT v KO, two-tailed unpaired t-test with Welch correction, P = 0.002). e. Representative traces of 20 min open field recordings for P180 SAPAP3 KO mice injected with either Astro GFP (gray) or Astro SAPAP3 (teal) and Neuro GFP (gray) or Neuro SAPAP3 (purple) injected at P28. Green dot depicts the location of the mouse at the start of the recording, while the red dot depicts the location of the mouse at the end of the recording. The center of the open field was 2.5 cm from the boundary wall. Bar graph shows assessment of locomotor activity by the metric of average speed. n = 14 mice for the Astro GFP group, n = 15 mice for the Astro SAPAP3 group, n = 8 for the Neuro GFP group, and n = 9 for the Neuro SAPAP3 group. The mean and SEM are shown (two-way ANOVA with Bonferroni post-hoc test). f. Bar graphs show assessment of grooming behavior in SAPAP3 WT and SAPAP3 KO treated with either saline or fluoxetine for 7 days by four different metrics: area of open lesions, number of lesions, grooming bouts, and time spent grooming. n = 5-6 mice for each group. The mean and SEM are shown (number of lesions per mouse: Kruskal Wallis test; number of grooming bouts: One way ANOVA with Bonferroni correction; time spent grooming: One way ANOVA with Bonferroni correction). g. Bar graphs show assessment of locomotor activity in SAPAP3 WT and SAPAP3 KO treated with either saline or fluoxetine for 7 days by two different metrics: total distance traveled and total average speed. n = 5 mice WT + saline, n = 6 mice WT + fluoxetine, n = 6 mice KO + saline, n = 6 mice KO + fluoxetine. The mean and SEM are shown (total distance traveled: one way ANOVA with Bonferroni correction; total average speed: one way ANOVA with Bonferroni correction). h. Bar graphs show assessment of anxiety-like behaviors in SAPAP3 WT and SAPAP3 KO treated with either saline or fluoxetine for 7 days by three different metrics: time in center, speed in center, and time spent in open arms. n = 4 mice WT + saline, n = 4 mice WT + fluoxetine, n = 7 mice KO + saline and n = 8 mice KO + fluoxetine. The mean and SEM are shown (time in center: One way ANOVA with Bonferroni correction; speed in center: one way ANOVA with Bonferroni correction; time spent in open arms: Kruskal-Wallis test).

