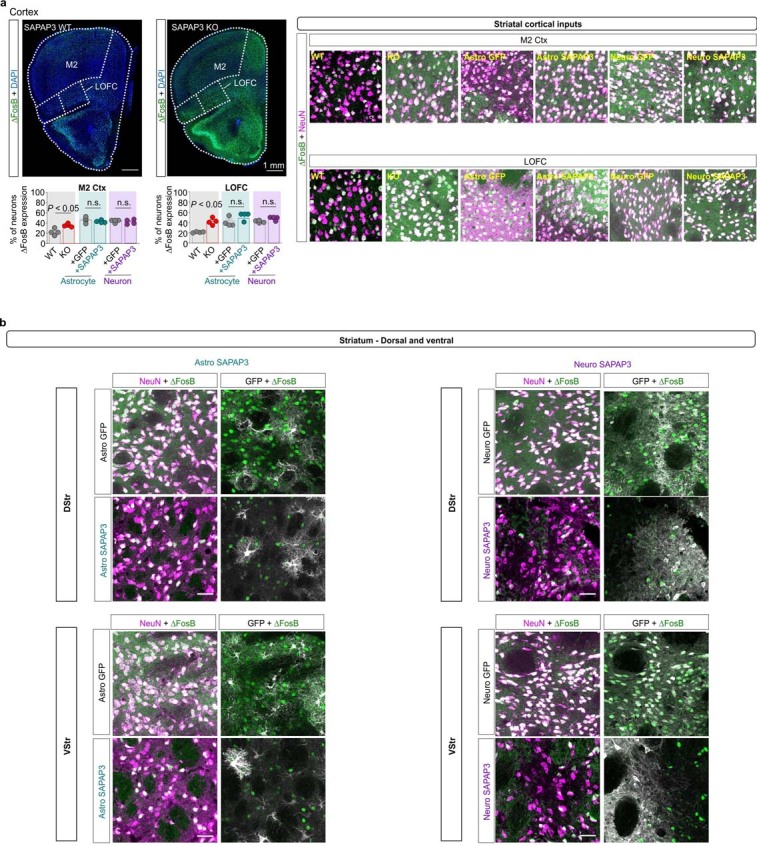
Extended Data Fig. 20. Mapping SAPAP3 associated changes with ΔFosB alterations.

a. Representative images show coronal sections containing both motor cortex (M2) and lateral orbitofrontal cortex (LOFC) in WT and SAPAP3 KO mice. Both LOFC and M2 of SAPAP3 KO mice show increased numbers of ΔFosB expressing cells. Scale bar represents 1 mm. Expanded images show neuronal (magenta) expression of ΔFosB (green) in M2 and OFC of wild type, SAPAP3 KO mice, SAPAP3 KO mice plus Astro GFP, SAPAP3 KO mice plus Astro SAPAP3, SAPAP3 KO mice plus Neuro GFP, and SAPAP3 KO mice plus Neuro SAPAP3. Scale bar represents 20 μm. Bar graphs depict the percent of NeuN+ neurons with ΔFosB expression. Bar denotes the mean, and error bars denote the SEM. n = 4 animals per group (One-way ANOVA with Bonferroni post hoc test). b. Representative zoom-in images of dorsal and ventral striatum in WT, SAPAP3 KO, SAPAP3 KO plus Astro GFP, SAPAP3 KO plus Astro SAPAP3, SAPAP3 KO plus Neuro GFP, and SAPAP3 KO plus Neuro SAPAP3 mice. Images show NeuN+ neurons (magenta) with expression of ΔFosB (green). Images also show the Astro GFP, Astro SAPAP3, Neuro GFP, and Neuro SAPAP3 signal (white) in the dorsal and ventral striatum. Scale bar represents 20 μm. This experiment was replicated four times.
