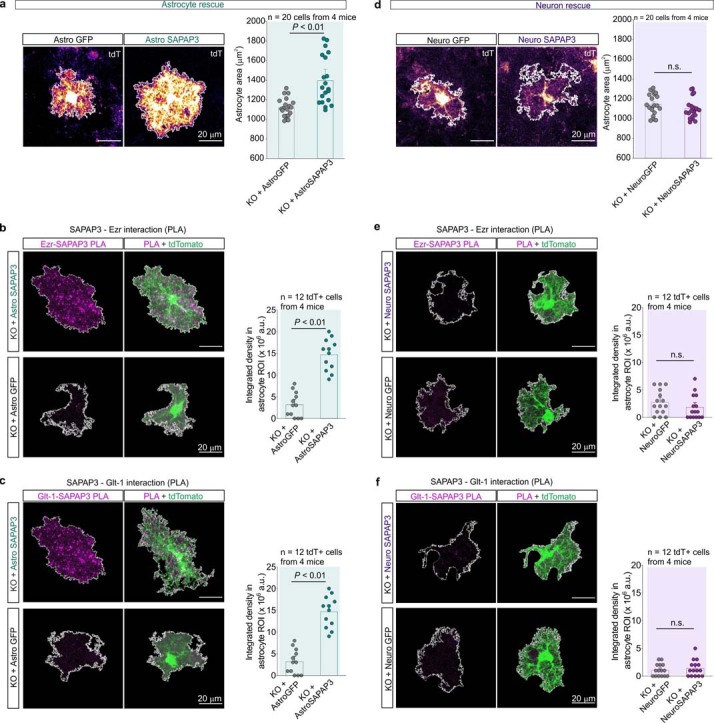
Extended Data Fig. 21. Effects of cell-specific rescue on astrocyte morphology and astrocyte-specific SAPAP3 interactions.

a. Representative images of tdTomato+ striatal astrocytes in SAPAP3 KO mice injected with Astro GFP (left) or Astro SAPAP3 (right). Bar graph shows the measurements of astrocyte territory area. n = 20 cells from 4 mice per group. The mean and SEM are shown (Astro GFP v Astro SAPAP3, two-tailed unpaired t-test with Welch correction, P = 0.001). b. Representative images of PLA puncta for SAPAP3 and Ezrin in SAPAP3 KO mice injected with Astro GFP or Astro SAPAP3. Images show SAPAP3-Ezr puncta within a tdTomato+ astrocyte. Bar graph denotes the integrated density in arbitrary units (a.u.) of the PLA signal within the astrocyte ROI. n = 12 tdTomato+ astrocytes from 4 mice per group. The mean and SEM are shown (Astro GFP v Astro SAPAP3, two-tailed unpaired t-test with Welch correction, P = 0.002). c. Representative images of PLA puncta for SAPAP3 and Glt-1 in SAPAP3 KO mice injected with Astro GFP or Astro SAPAP3. Images show SAPAP3-Glt-1 puncta within a tdTomato+ astrocyte. Bar graph denotes the integrated density in arbitrary units (a.u.) of the PLA signal within the astrocyte ROI. n = 12 tdTomato+ astrocytes from 4 mice per group. The mean and SEM are shown (Astro GFP v Astro SAPAP3, two-tailed unpaired t-test with Welch correction, P < 0.001). d. Representative images of tdTomato+ striatal astrocytes in SAPAP3 KO mice injected with Neuro GFP (left) or Neuro SAPAP3 (right). Bar graph shows the measurements of astrocyte territory area. n = 20 cells from 4 mice per group. The mean and SEM are shown (Neuro GFP v Neuro SAPAP3, two-tailed unpaired t-test with Welch correction). e. Representative images of PLA puncta for SAPAP3 and Ezrin in SAPAP3 KO mice injected with Neuro GFP or Neuro SAPAP3. Images show SAPAP3-Ezr puncta within a tdTomato+ astrocyte. Bar graph denotes the integrated density in arbitrary units (a.u.) of the PLA signal within the astrocyte ROI. n = 12 tdTomato+ astrocytes from 4 mice per group. The mean and SEM are shown (Neuro GFP v Neuro SAPAP3, two-tailed Mann-Whitney test, P = 0.59). f. Representative images of PLA puncta for SAPAP3 and Glt-1 in SAPAP3 KO mice injected with Neuro GFP or Neuro SAPAP3. Images show SAPAP3-Glt-1 puncta within a tdTomato+ astrocyte. Bar graph denotes the integrated density in arbitrary units (a.u.) of the PLA signal within the astrocyte ROI. n = 12 tdTomato+ astrocytes from 4 mice per group. The mean and SEM are shown (Neuro GFP v Neuro SAPAP3, two-tailed Mann-Whitney test, P = 0.98).
