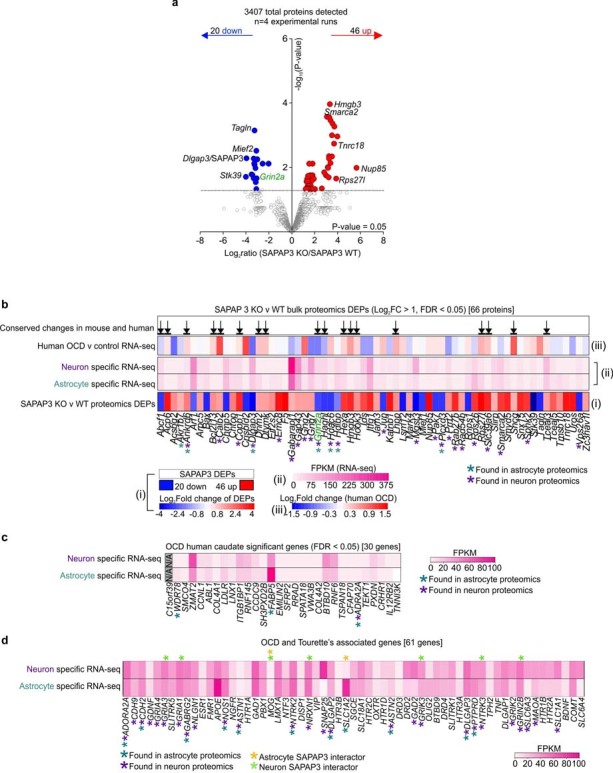
Extended Data Fig. 22. Bulk proteomics for WT and SAPAP3 KO mice and comparison to human striatal data.

a. Volcano plot shows the label-free based quantification comparison of 3407 proteins detected in the striatum. Red circles show upregulated proteins (Log2FC > 1 and FDR < 0.05) while blue circles show downregulated proteins (Log2FC < 1, FDR < 0.05) in the SAPAP3 KO striatum when compared to wild-type. The top 5 most down regulated and up regulated proteins are shown. Green label shows protein that also appeared in the neuron SAPAP3 interactome. b. List of the 66 proteins that were differentially expressed in the striatum of SAPAP3 KO mice when compared to wild type controls. Heat map and color scale (i) shows the Log2fold change of the 66 proteins versus wild type control. Heat map and color scale (ii) shows the mRNA abundance (FPKM) of the 66 proteins in our neuron or astrocyte specific mouse RNA-seq datasets. Heat map and color scale (iii) shows the Log2fold change at the mRNA level of the 66 proteins in human caudate of OCD subjects compared to controls. Arrowheads show genes that had conserved changes in the mouse SAPAP3 KO model and human OCD. Teal asterisks denote whether the protein was found in the astrocyte specific proteomics datasets, while the purple asterisks denote whether the protein was found in the neuron specific datasets. c. List of proteins shows the 30 significantly (FDR < 0.05) changed genes in human OCD caudate versus control. Heat map depicts the genes’ respective mRNA abundances (FPKM) in our neuron or astrocyte specific mouse RNA-seq datasets. Teal asterisks denote whether the protein was also found in the astrocyte specific proteomics datasets while the purple asterisks denote whether the protein was found in the neuron specific datasets. The gene, C15orf39, was not found in our mouse datasets. d. List of 61 genes associated with OCD and Tourette’s syndrome. Heat map depicts the genes’ respective mRNA abundances (FPKM) in our neuron or astrocyte specific mouse RNA-seq datasets. Teal asterisks denote whether the protein was also found in the astrocyte specific proteomics datasets while the purple asterisks denote whether the protein was found in the neuron specific datasets. Orange asterisks denote whether the protein was an astrocytic SAPAP3 interactor, while green asterisks denote whether the protein was a neuronal SAPAP3 interactor.
