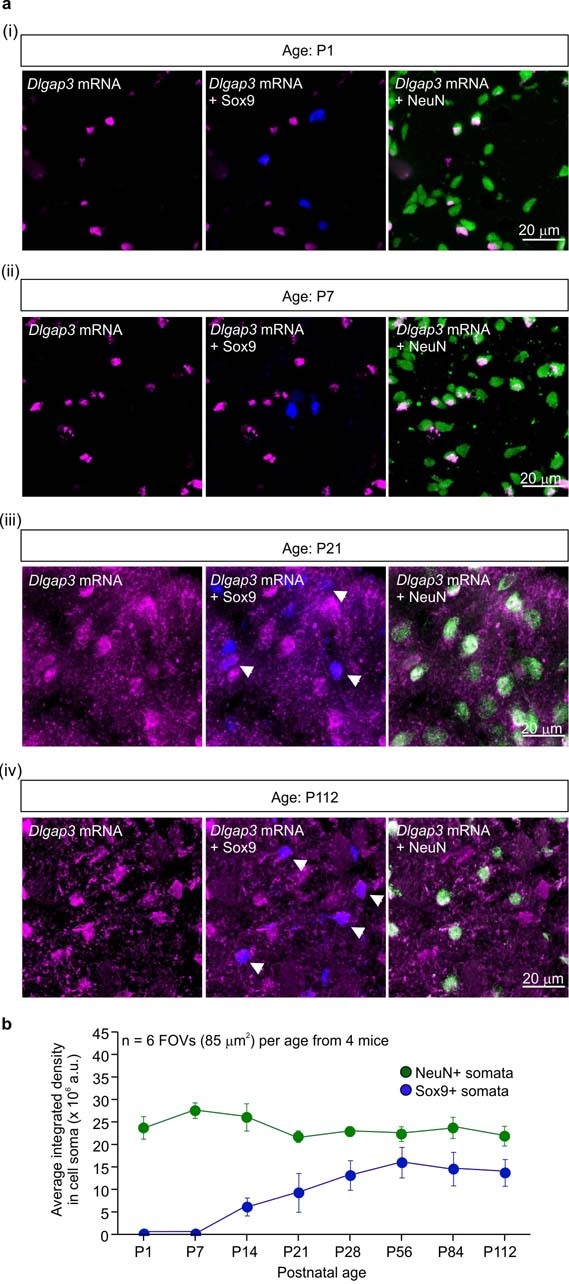
Extended Data Fig. 23. Assessment of Dlgap3 mRNA expression across age using in situ hybridization.

a. (i-iv) Representative images of P1-P112 mouse striata with Dlgap3 mRNA in magenta, Sox9 astrocyte marker protein in blue, and NeuN neuronal marker protein in green. White arrowheads show Dlgap3 expression in Sox9+ astrocytes. b. Line graph shows the average integrated intensity of Dlgap3 mRNA in either NeuN+ somata (green) or Sox9+ somata (blue) across 8 postnatal ages. Data are presented as the mean and the SEM; n = 6 FOVs per age from 4 mice per age.
