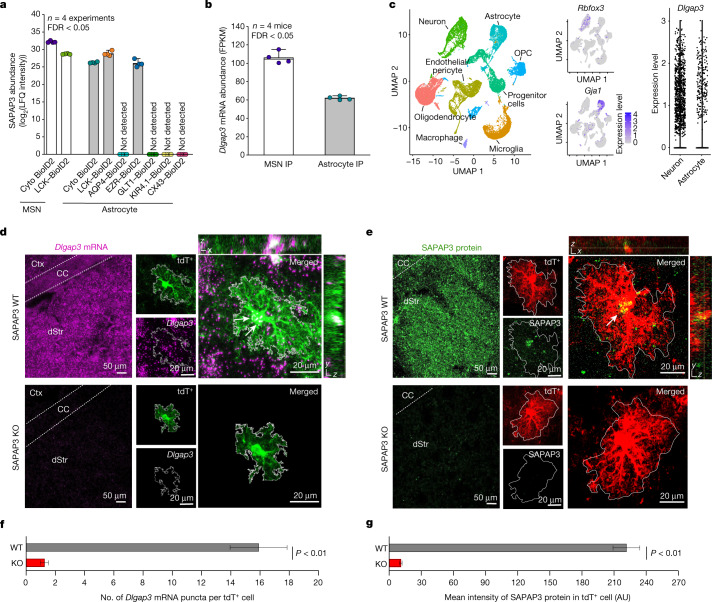
Fig. 3. SAPAP3 expression in striatal astrocytes.
a, SAPAP3 protein abundance across the neuronal and astrocytic subcompartments. Not detected, SAPAP3 was not detected. Mean and s.e.m. are shown. b, Dlgap3 mRNA abundance measured in fragments per kilobase of exon per million, mapped fragments (FPKM) in neuronal or astrocyte RiboTag immunoprecipitation (IP). Mean and s.e.m. are shown. c, Left, uniform manifold approximation and projection (UMAP) plot of striatal cells (n = 31,956 individual cells, replotted from our published scRNA-seq data36. Middle, expression of Rbfox3 in neurons and Gja1 in the astrocytes. Right, violin plot showing the relative expression level of Dlgap3 per cell in neurons and astrocytes. Expression level is defined as the log2 normalized gene count per cell. OPC, oligodendrocyte precursor cell. d, Representative image of the dorsal striatum (dStr) from either WT or SAPAP3 KO mice labelled by RNAscope in situ hybridization for Dlgap3 mRNA (purple) and by IHC for tdTomato+ (tdT+) astrocytes (green). Left images show Dlgap3 mRNA abundance throughout the entire striatum. Expanded images show dorsal striatum tdTomato+ astrocytes express Dlgap3 mRNA (white arrows). e, Representative image of the dorsal striatum from either WT or SAPAP3 KO mice labelled by IHC for SAPAP3 protein (green). Left images show SAPAP3 protein abundance in the striatum. Expanded images show tdTomato+ dorsal striatum astrocytes express SAPAP3 protein (white arrow). f, The number of Dlgap3 mRNA puncta within tdTomato+ astrocytes in either WT or SAPAP3 KO mice. g, Intensity in arbitrary units (AU) of SAPAP3 protein within tdTomato+ astrocytes in either WT or SAPAP3 KO mice. For f and g, mean and s.e.m. are shown; n = 20 tdTomato+ astrocytes from 4 mice per group (two-tailed Mann–Whitney test).

