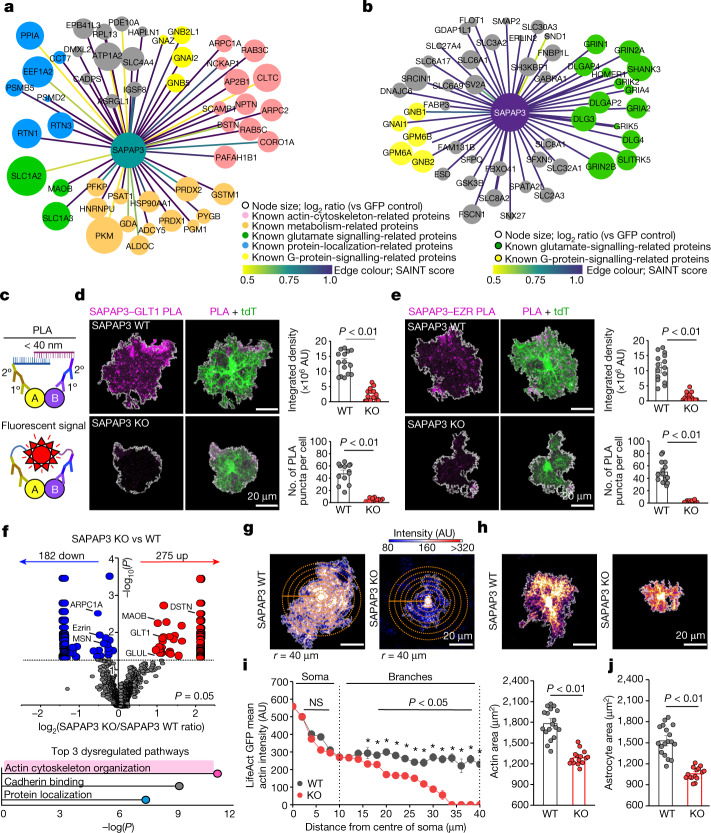
Fig. 4. Molecular interactions and cellular mechanisms of SAPAP3.
a, Map of SAPAP3-interacting astrocyte proteins, identifying 49 distinct proteins. Edge colour represents SAINT interaction score. Colour legends denote PANTHER GO terms. b, As in a but for SAPAP3-interacting neuronal proteins and showing the top 50 distinct proteins. c, Schematic of the PLA. d, Left, images of PLA puncta for SAPAP3 and GLT1 in tdTomato+ astrocytes (WT and SAPAP3 KO). Right, summary graphs. e, As in d but for SAPAP3 and ezrin proteins (WT and SAPAP3 KO). For d and e, mean and s.e.m. are shown; n = 15 tdTomato+ astrocytes from 3 mice per group (integrated density and number of PLA puncta per cell; two-tailed Mann–Whitney test). f, Top, differentially displayed astrocyte PM proteins in SAPAP3 KO mice from Astro LCK–BiolD2 proteomics. Bold depicts proteins related to the actin cytoskeleton (from a). n = 3 technical replicates from 5 mice each. Bottom, graph of significant molecular function Enrichr GO terms for proteins from the top graph. g, Images showing LifeAct GFP in WT and SAPAP3 KO astrocytes. Concentric circles (5 μm) were used for intensity measurements. h, Images showing WT and SAPAP3 KO tdTomato+ astrocytes. i, Left, LifeAct GFP mean actin intensity as a function of distance from astrocyte somata (points represent mean intensity from 15–18 cells per group, 4 mice). The error bars depict the s.e.m. (two-way repeated measures analysis of variance (ANOVA) with Bonferroni post hoc test; P = 0.012 at 20–40 μm). Right, the astrocyte actin territory area. The mean and s.e.m. are shown; n = 15 WT and 18 SAPAP3 KO LifeAct+ astrocytes, 4 mice (two-tailed unpaired t-test with Welch correction). NS, not significant. j. Astrocyte territory area; n = 15 WT and 18 SAPAP3 KO tdTomato+ astrocytes from 4 mice per group. The mean and s.e.m. are shown (two-tailed unpaired t-test with Welch correction).

