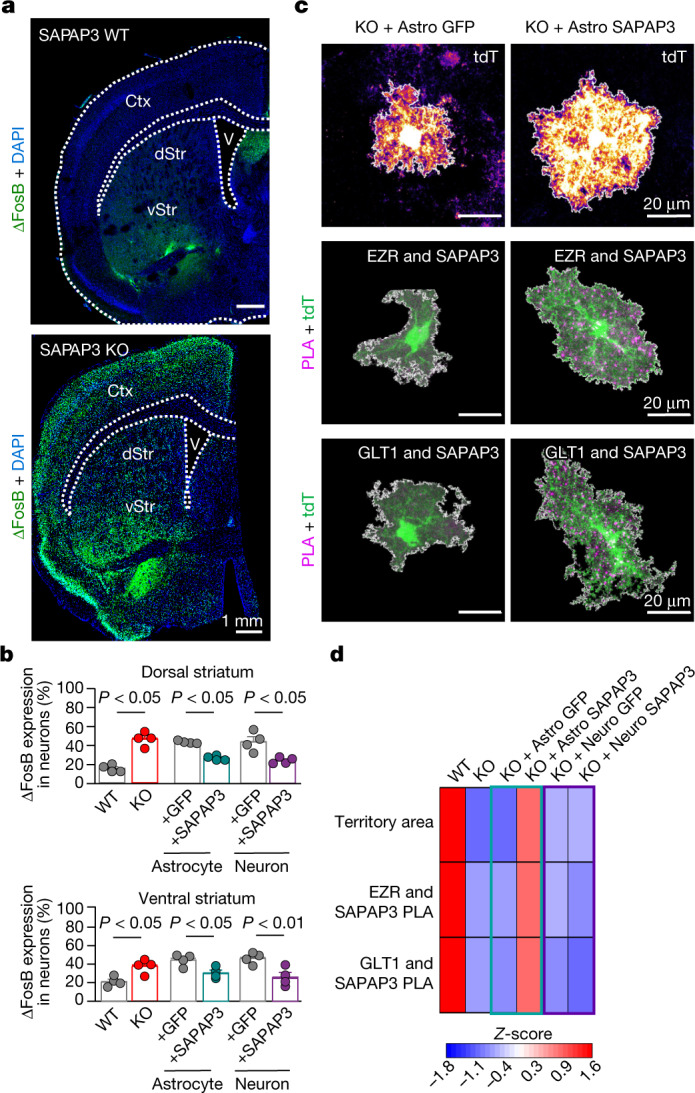
Fig. 6. Effect of SAPAP3 loss and rescue on neuronal ΔFosB levels and SAPAP3 interactions.

a, Images of coronal sections containing striatum in WT and SAPAP3 KO mice. Both dorsal striatum (dStr) and ventral striatum (vStr) showed increased numbers of ΔFosB-expressing cells. b, The percentage of NeuN+ neurons with ΔFosB expression in both dorsal and ventral striatum. Bar denotes the mean, and error bars denote the s.e.m. n = 4 animals per group (one-way ANOVA with Bonferroni post hoc test). c, Images of tdTomato+ striatal astrocytes in SAPAP3 KO mice injected with Astro GFP or Astro SAPAP3 (n = 20 cells, 4 mice each). Representative images also show PLA puncta for SAPAP3 and EZR and for SAPAP3 and GLT1 in SAPAP3 KO mice injected with Astro GFP or Astro SAPAP3 (n = 12 cells, 4 mice each). Note that in these cases, we used tdTomato as the astrocyte reporter to achieve spectral separation from Astro GFP and GFP-tagged SAPAP3. d, Heatmap depicting the Z-scores of the measured parameters in astrocytes in WT and SAPAP3 KO mice, SAPAP3 KO mice injected with Astro GFP or with Astro SAPAP3 and SAPAP3 KO mice injected with Neuro GFP or with Neuro SAPAP3. The colour legend shows the Z-score. Bar graphs and the raw replicate values are in Extended Data Fig. 21.
