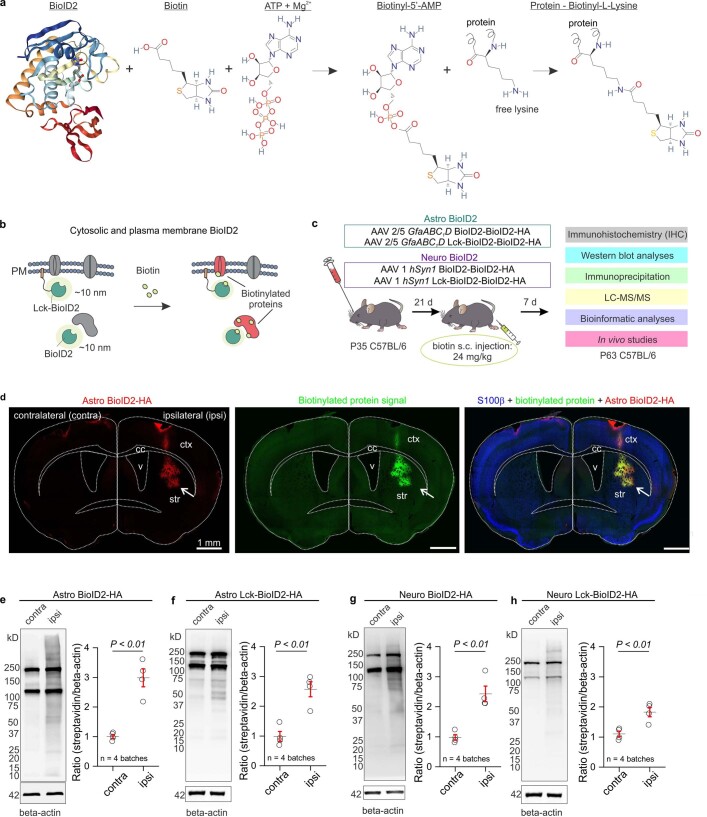
Extended Data Fig. 2. Proteomics workflow and western blot data.
a. Schematic of the BioID2 biotinylation reaction in the presence of biotin, Mg2+, and ATP. Free lysine residues on a protein are biotinylated. b. Diagram of BioID2 biotin labeling in mammalian cells. Proximal (~10 nm) proteins are biotinylated upon the addition of exogenous biotin. c. Schematic of the cell and compartment specific in vivo BioID2 experimental design using adeno-associated viruses (AAVs). d. 40 μm coronal section of mouse brain microinjected in the dorsal striatum with AAV 2/5 GfABC1D BioID2-HA (Astro BioID2) and injected subcutaneously with biotin for 7 days. Arrows show the site of Astro BioID2-HA injection and the site of increased biotinylation. e. Western blot analysis of brain unilaterally microinjected with Astro BioID2. Dark bands at 130 kD and 250 kD show the endogenously biotinylated mitochondrial proteins, Pyruvate carboxylase and acetyl-CoA carboxylase. Graph depicting the streptavidin signal intensity divided by the β-actin signal intensity for each data point. Black horizontal line depicts the mean, red lines depict the SEM (n = 4 mice; two-tailed paired t-test, P = 0.0052). f. Western blot analysis of brain unilaterally microinjected with plasma membrane localized Astro Lck-BioID2. Graph depicting the streptavidin signal intensity divided by the β-actin signal intensity for each data point. Black horizontal line depicts the mean, red lines depict the SEM (n = 4 mice; two-tailed paired t-test, P = 0.0088). g. Western blot analysis of brain unilaterally microinjected with AAV1 hSyn1 BioID2-HA (Neuro BioID2). Graph depicting the streptavidin signal intensity divided by the β-actin signal intensity for each data point. Black horizontal line depicts the mean, red lines depict the SEM (n = 4 mice; two-tailed paired t-test, P = 0.015). h. Western blot analysis of brain unilaterally microinjected with plasma membrane localized Neuro Lck-BioID2. Graph depicting the streptavidin signal intensity divided by the β-actin signal intensity for each data point. Black horizontal line depicts the mean, red lines depict the SEM (n = 4 mice; two-tailed paired t-test, P = 0.0023). For blot source data, see Supplementary Fig. 1.

