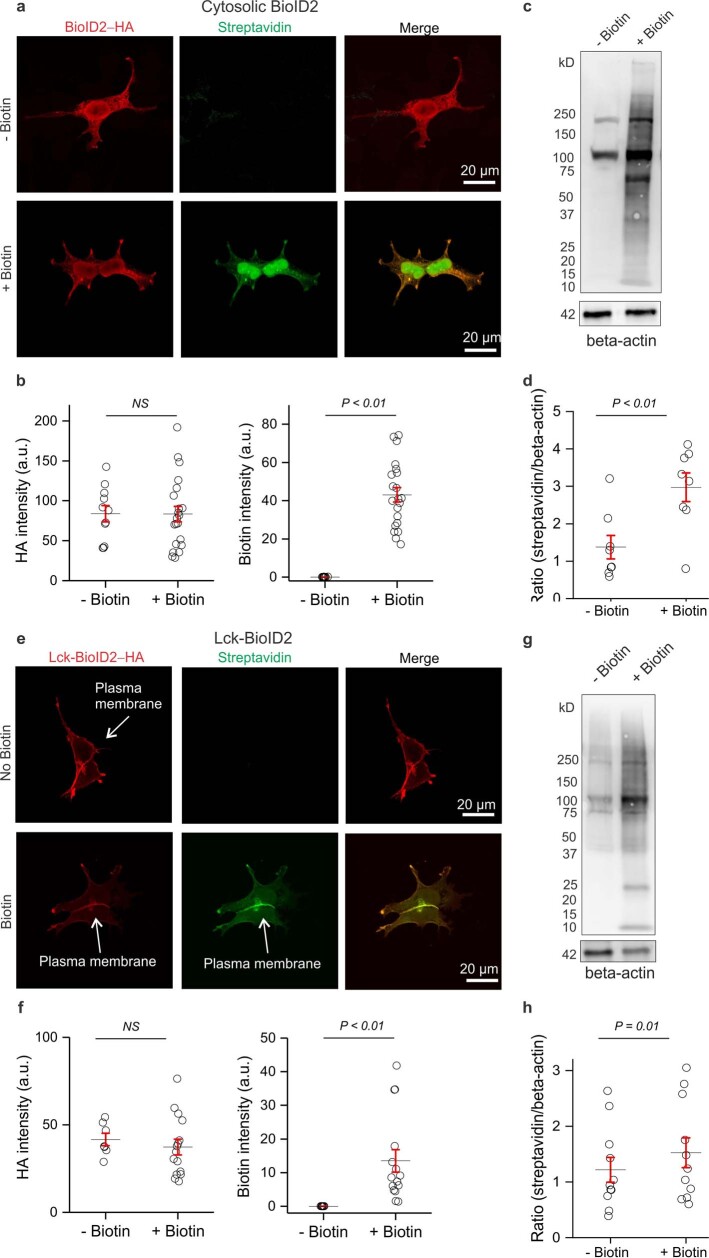
Extended Data Fig. 3. Validation experiments in HEK-293T cells.
a. Representative images of HEK-293T cells transfected with the cytosolic BioID2 construct and then treated with either biotin in PBS or solely PBS (no biotin). The cells were immunostained with both anti-HA antibody (red) and a fluorophore conjugated streptavidin probe (green). b. Quantification of HA intensity and biotin intensity (arbitrary units) in cells transfected with cytosolic BioID2. Black horizontal line depicts the mean, red lines depict the SEM (n = 11 cells in the no biotin group and n = 21 cells in the biotin group from 4 transfections; two-tailed unpaired t-test, P = 0.97 and P = 0.0001, respectively). c. Representative western blot of HEK-293T cells transfected with cytosolic BioID2 and treated with either biotin in PBS or solely PBS (no biotin). d. Western blot quantification of HEK293T cells transfected with cytosolic BioID2 and treated with either biotin in PBS or solely PBS (no biotin). Graph depicting the streptavidin signal intensity divided by the β-actin signal intensity for each data point. Black horizontal line depicts the mean, red lines depict the SEM (n = 8 coverslips from 3 transfections; two-tailed unpaired t-test, P = 0.0062). e. Representative images of HEK-293T cells transfected with the plasma membarane Lck-BioID2 construct and then treated with either biotin in PBS or solely PBS (no biotin). The cells were immunostained with both anti-HA antibody (red) and a fluorophore conjugated streptavidin probe (green). Arrows show the plasma membrane localization. f. Quantification of HA intensity and biotin intensity (arbitrary units) in cells transfected with Lck-BioID2. Black horizontal line depicts the mean, red lines depict the SEM (n = 8 cells in the no biotin group and n = 21 cells in the biotin group from 4 transfections; two-tailed unpaired t-test, P = 0.91 and P = 0.0084, respectively). g. Representative western blot of HEK-293T cells transfected with Lck-BioID2 and treated with either biotin in PBS or solely PBS (no biotin). h. Western blot quantification of HEK293T cells transfected with Lck-BioID2 and treated with either biotin in PBS or solely PBS (no biotin). Graph depicting the streptavidin signal intensity divided by the β-actin signal intensity for each data point. Black horizontal line depicts the mean, red lines depict the SEM (n = 11 coverslips from 3 transfections; two-tailed unpaired t-test, P = 0.01). For blot source data, see Supplementary Fig. 1.

