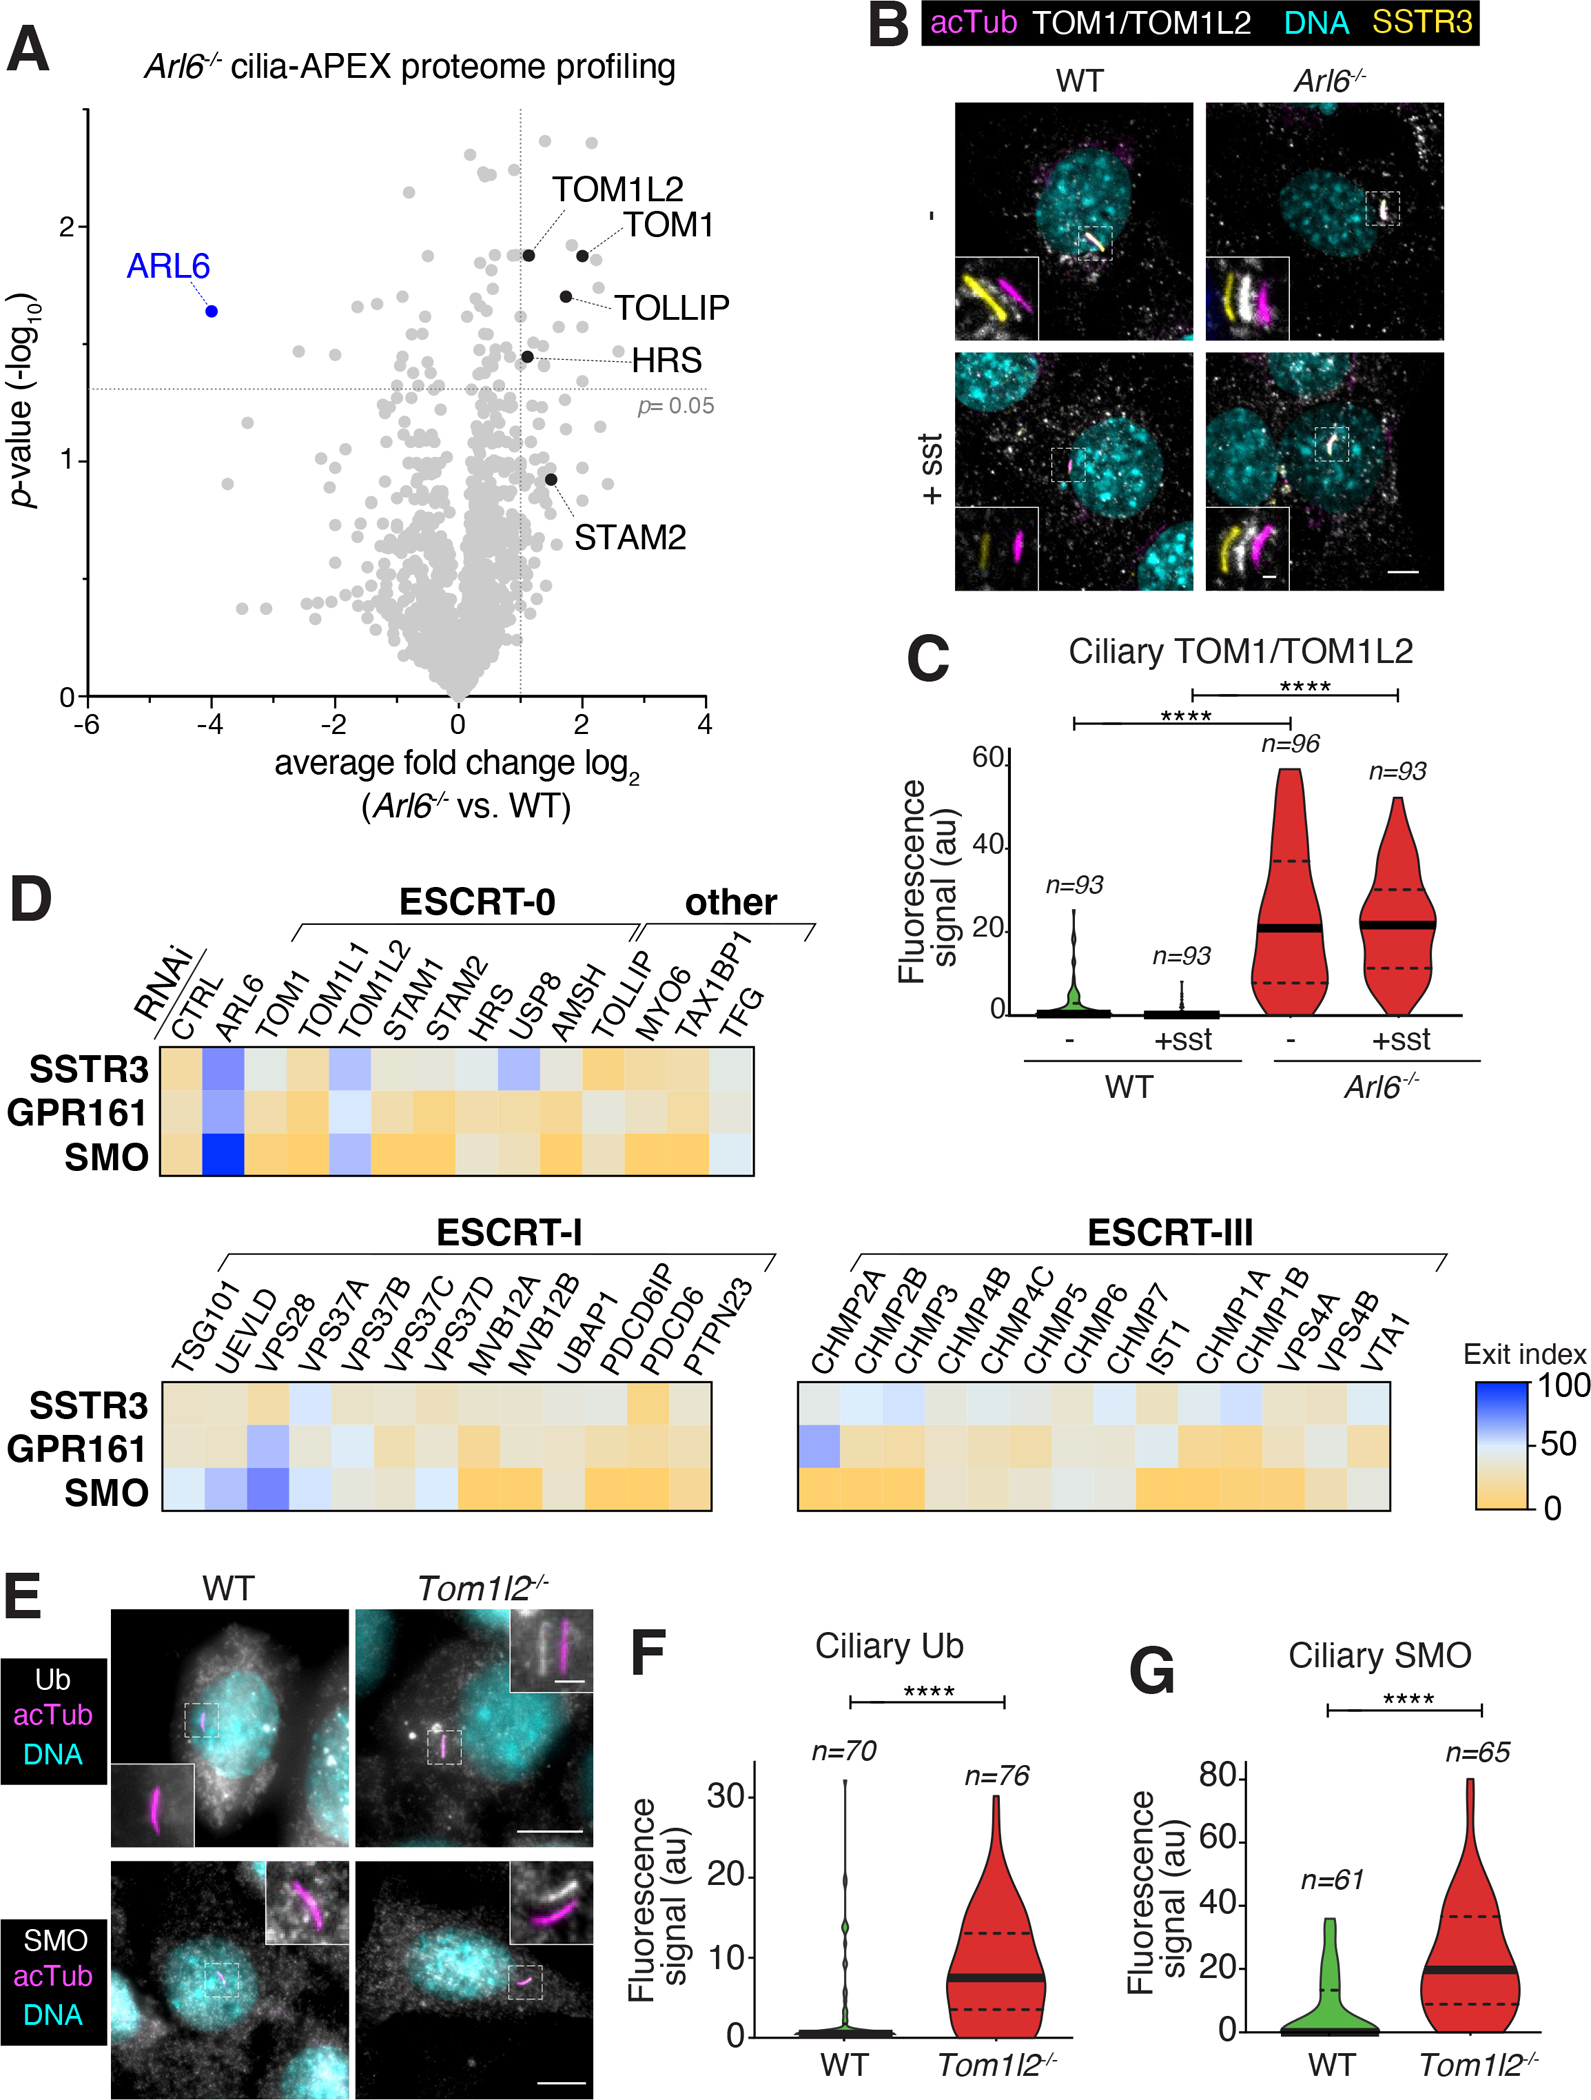
Figure 2. Identification of TOM1L2 as a ciliary retrieval factor by proteomics profiling and functional screening.

A. Wildtype (WT) and Arl6 −/− IMCD3 cells were subjected to Cilia-APEX proteomics. Hits are presented in a volcano plot of statistical significance versus protein enrichment. Known UbK63 readers enriched in the Arl6 −/− cilia proteome are shown as black dots. See Table S1 for complete data set. B. WT or Arl6 −/− IMCD3 cells stably expressing SSTR3 fused to mNeonGreen (NG) were treated with or without somatostatin-14 (sst) for 2 h, then fixed and stained for acetylated tubulin (acTub, magenta) and TOM1/TOM1L2 (white). SSTR3NG was imaged through the intrinsic fluorescence of NG (yellow). In these and every subsequent insets, channels are shifted to facilitate visualization of ciliary signals. Scale bar: 5μm (main panel), 1μm (inset). C. The ciliary fluorescence intensity of the TOM1/TOM1L2 channel was measured in each condition, and the data are represented as violin plots. In this and every subsequent violin plot, the dotted lines indicate the first and third quartiles and the thick bar is the median. Asterisks indicate statistical significance values calculated by one-way ANOVA followed by Tukey’s post hoc test. ****, p ≤ 0.0001. D. IMCD3 cells stably expressing SSTR3NG or GPR161NG were transfected with indicated siRNAs for 48h. IMCD3-[SSTR3NG] cells were treated with or without sst for 6 h, fixed, and stained for acetylated tubulin. IMCD3-[GPR161NG] cells were treated with or without SAG for 3 h, fixed and stained for acetylated tubulin and SMO. SSTR3NG and GPR161NG were imaged through the intrinsic fluorescence of NG. The fluorescence intensities of SSTR3NG, GPR161NG, and SMO in the cilium were measured in each condition. Median fluorescence intensities with sst (SSTR3NG) or SAG (GPR161NG) treatment were normalized to untreated conditions and are represented as exit index on the heat map (see Methods for details). For SMO, median fluorescence intensities in untreated conditions are represented as exit index on the heat map. The depletion efficiencies of representative proteins are shown in Fig. S2A. The measurements of ciliary fluorescence for each GPCR are shown in Fig. S3. E. Ciliated WT or Tom1l2−/− cells were fixed and stained for acetylated tubulin (acTub, magenta) and Ub (white) or SMO (white). For the Ub stain, cells were incubated with SAG for 2h prior to fixation to promote GPR161 exit. Scale bar: 5μm (main panel), 1μm (inset). F. The fluorescence intensity of the ubiquitin channel in the cilium was measured in each condition, and the data are represented as violin plots. Asterisks indicate unpaired t-test significance value. **, p ≤ 0.01. n = 45–48 cilia. G. The fluorescence intensities of ciliary SMO are represented as violin plots. Asterisks indicate unpaired t-test significance value. ****, p ≤ 0.0001. n = 55–59 cilia.
