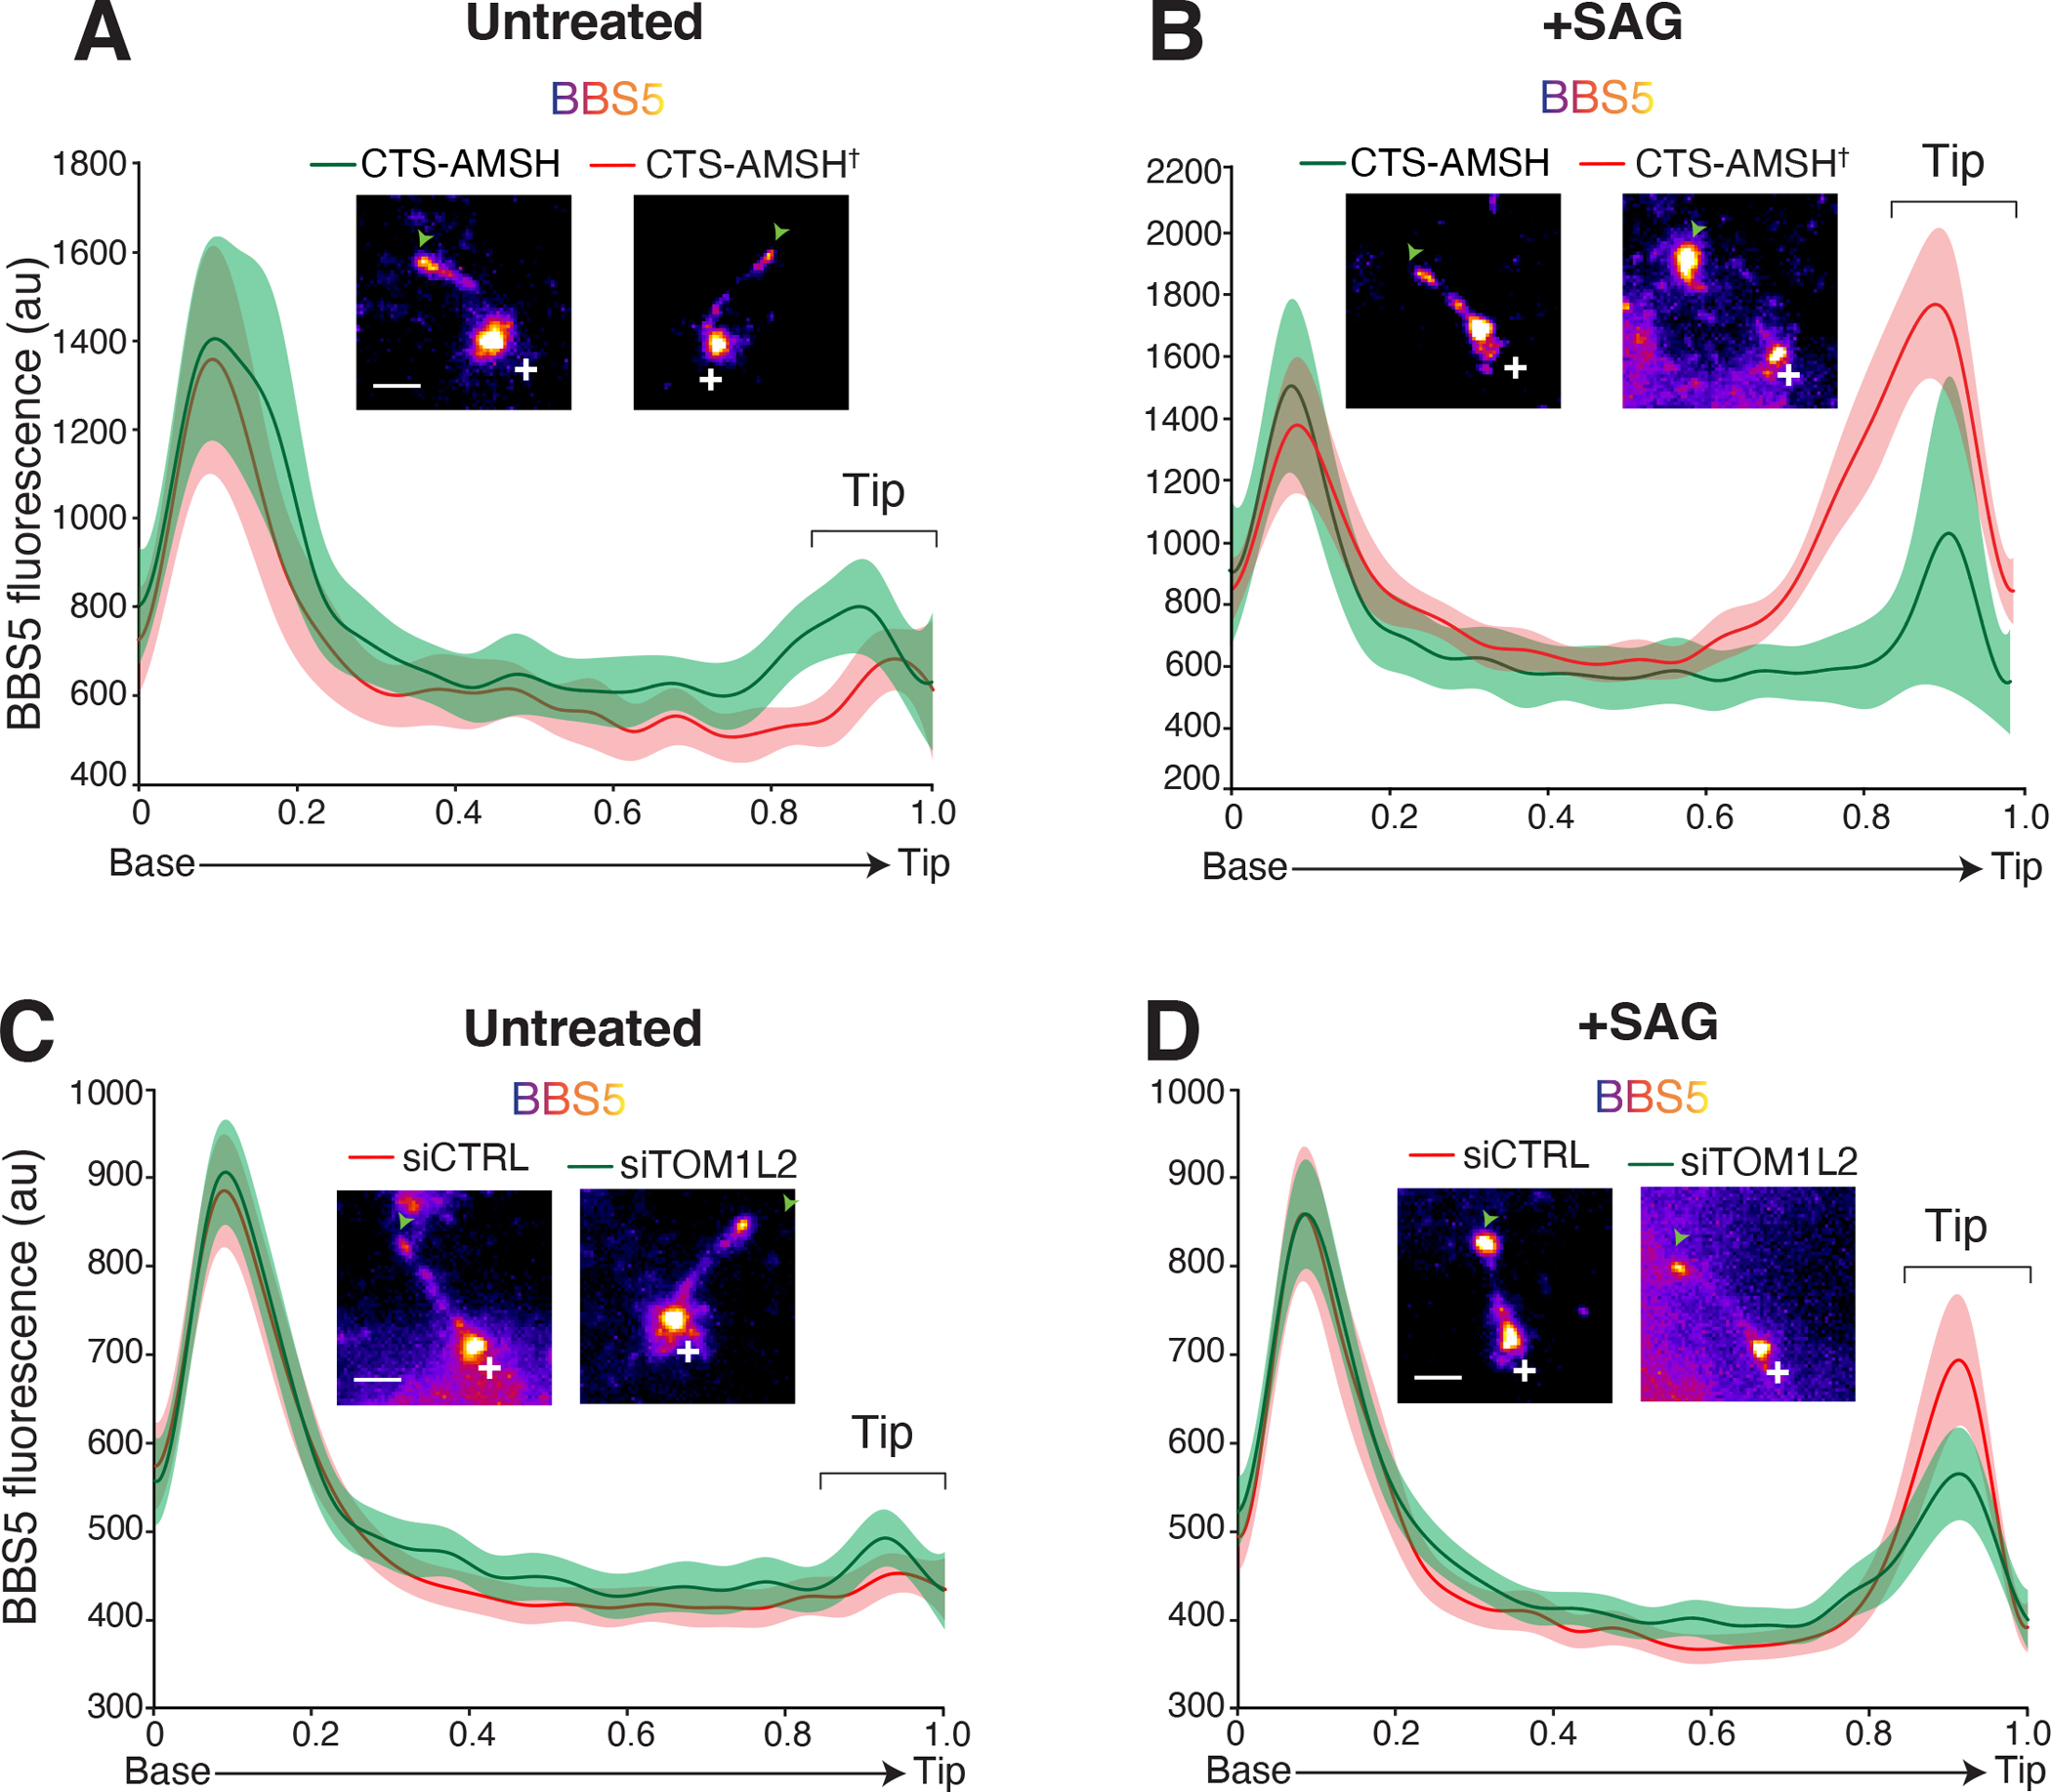
Figure 3. TOM1L2 functions between the BBSome and ubiquitin recognition.

Line scans of NG3BBS5 fluorescence intensities along cilia and corresponding micrographs. Representative images of cilia are shown in insets. Scale bar: 1μm. NG3BBS5 is in fire scale, a white cross marks the location of the base, and an arrowhead marks the tip of the cilia. In all line scans, the line marks the mean intensity along length-normalized cilia and the shaded area shows the 95% confidence interval. A-B. Control- and UbK63-depleted cilia. IMCD3-[pEF1α-NG3BBS5] were transfected with plasmids expressing the ciliary targeting signal (CTS) of NPHP3 fused to mScarlet and either the catalytic domain of the K63-specific deubiquitinase AMSH, or the catalytically inactive E280A variant (AMSH†). Cells were serum starved and then left untreated (A) or treated with SAG (B) for 40 min before fixation and TIRF imaging of NeonGreen fluorescence. See Fig. S4A for additional images. n = 9–11 cilia. C-D. Control- and TOM1L2-depleted cells. IMCD3-[pEF1α-NG3BBS5] were transfected with non-targeting control siRNAs (siCTRL) or TOM1L2 siRNAs (siTOM1L2), serum-starved, and either left untreated (C) or treated with SAG (D) for 40 min. Cells were then fixed and NeonGreen fluorescence was imaged by TIRF. See Fig. S4B for additional images. n = 30–45 cilia.
