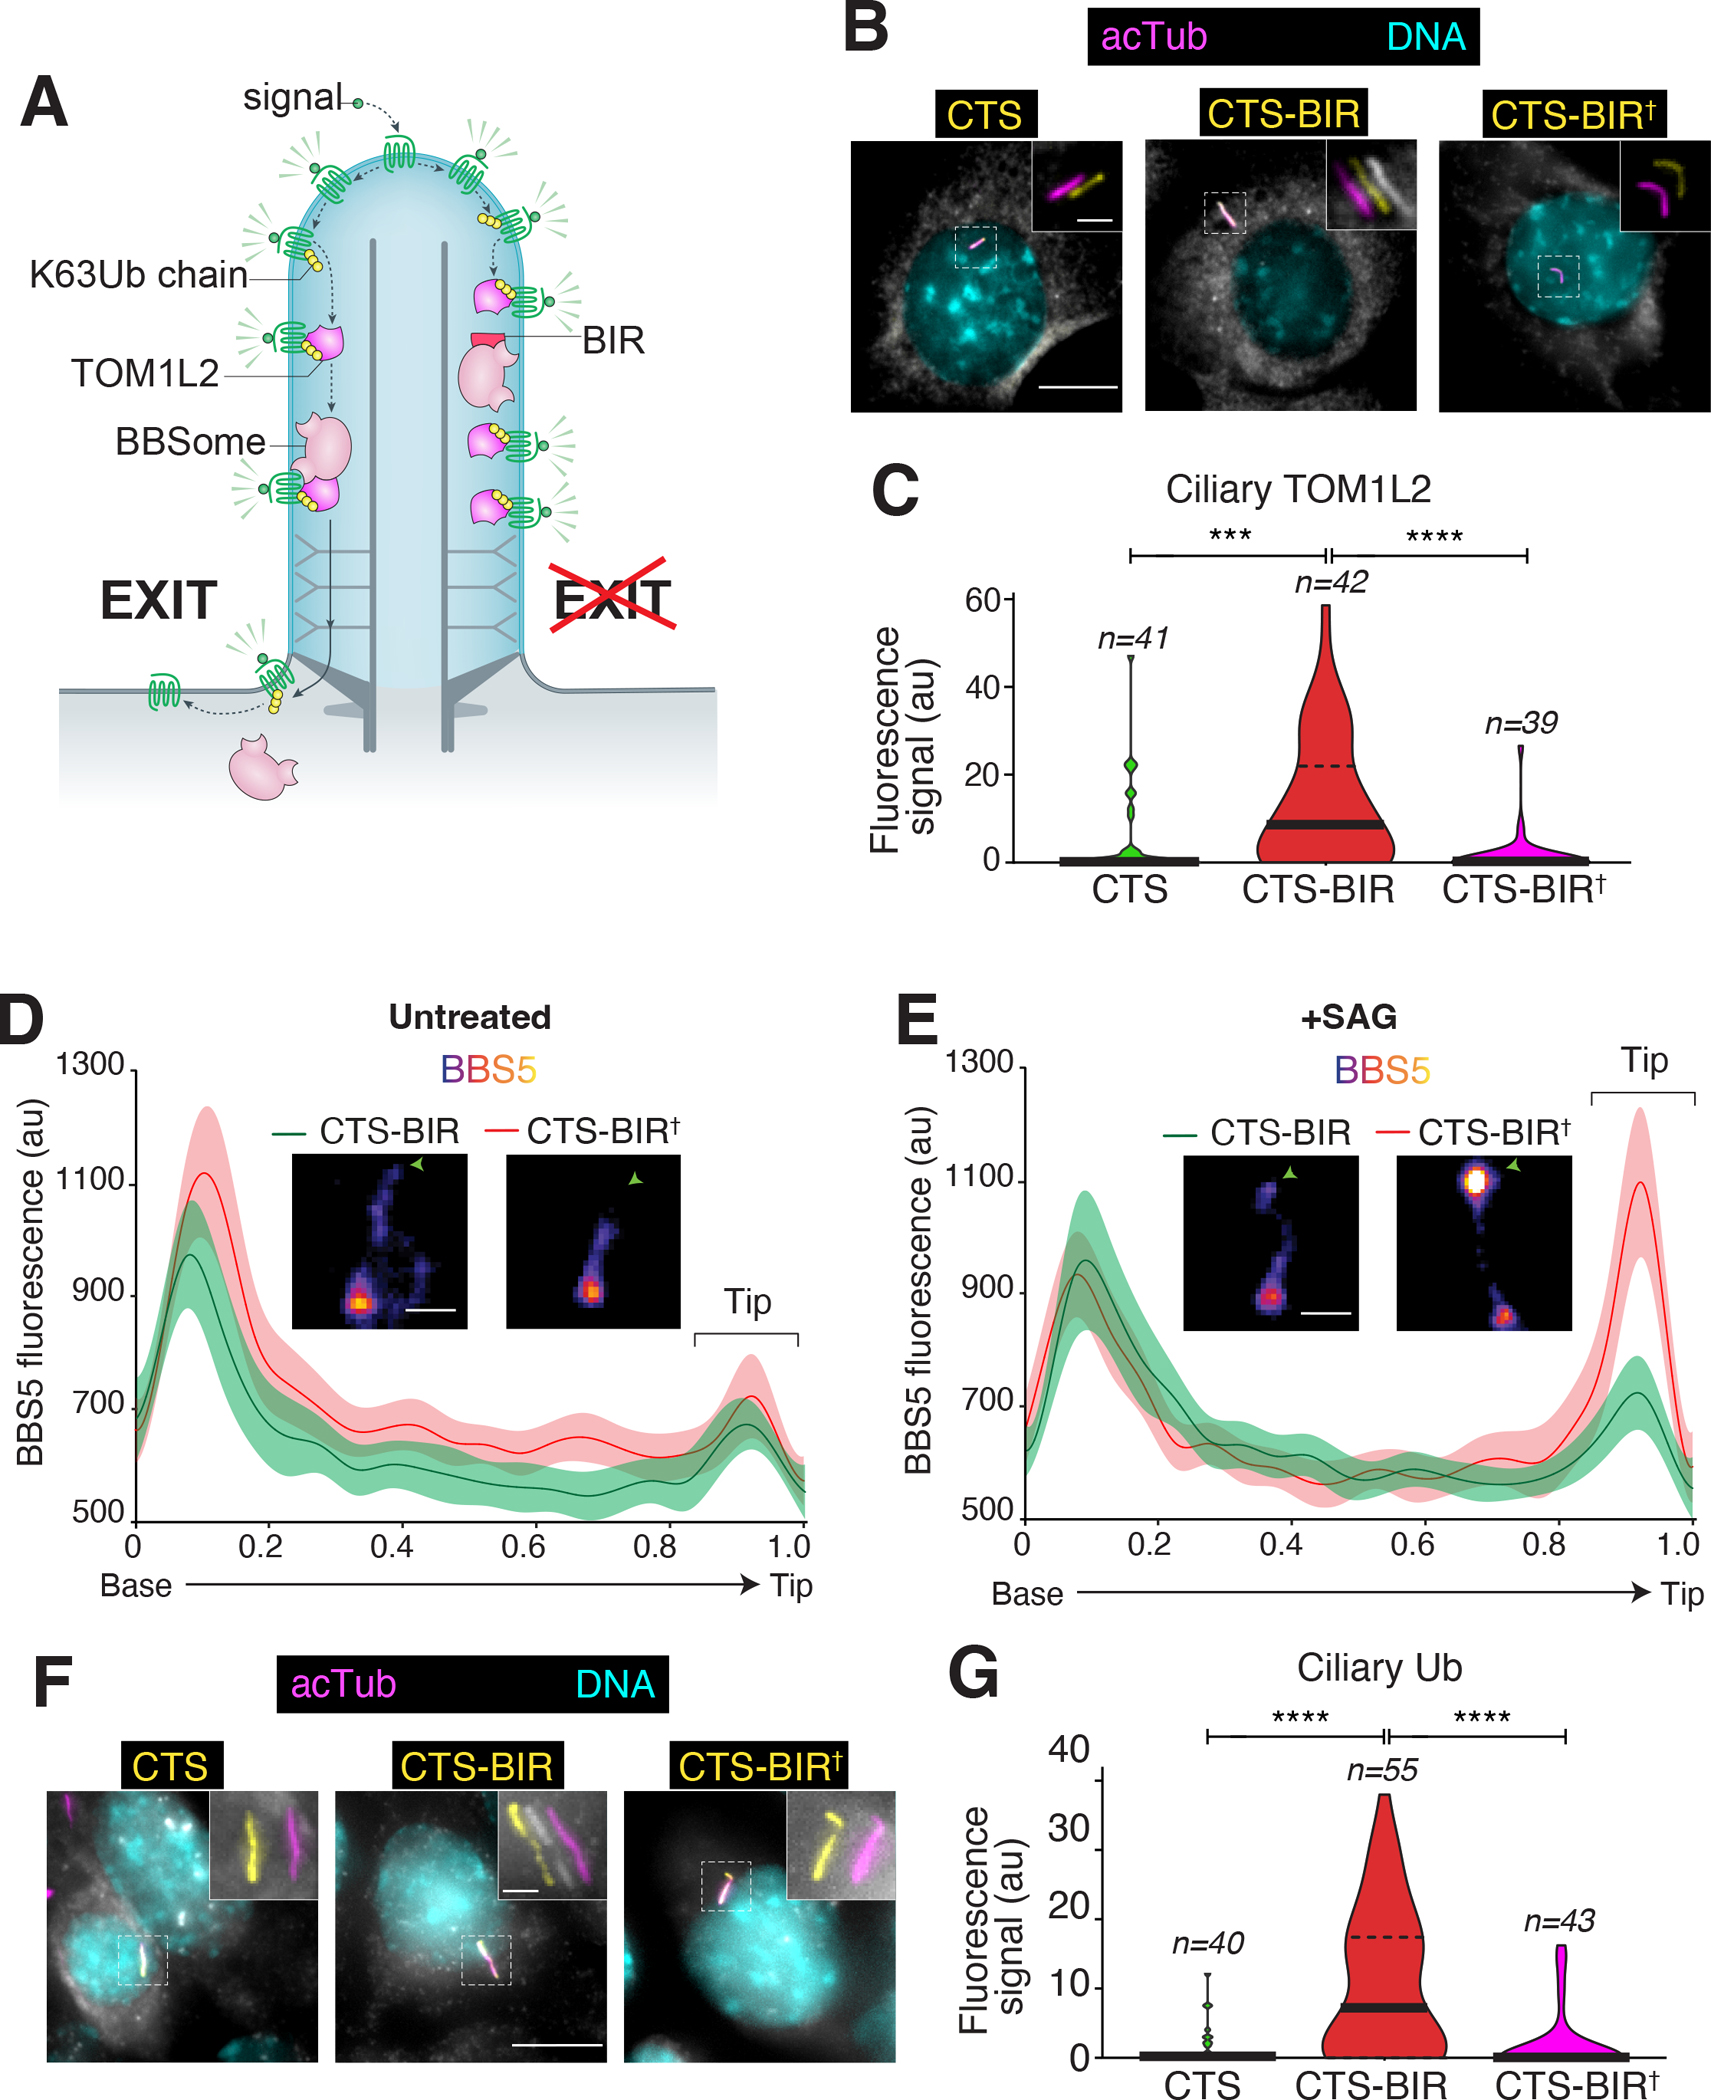
Figure 5. Targeted disruption of the BBSome-TOM1L2 interaction blocks the exit of ubiquitinated proteins and of TOM1L2 from cilia.

A. Diagram of the working model and the experimental strategy. B. IMCD3-[pEF1α-TOM1L2FLAG3] cells were transfected with plasmids expressing the ciliary targeting signal (CTS) of NPHP3 fused to GFP, or CTS fused to GFP and the BBSome binding motif of TOM1L2 (BIR), or to GFP and the 441WLR443/AAA mutant of the BIR defective in BBSome binding (BIR†). Cells were serum-starved 24h later, fixed after another 24h, and stained for acetylated tubulin (acTub; magenta), FLAG (TOM1L2, white), and DNA (cyan). The CTS fusions were visualized through the intrinsic fluorescence of GFP (yellow). Scale bars, 5 μm (main panel), 1 μm (inset). C. The fluorescence intensities of ciliary TOM1L2FLAG3 are represented as violin plots. n = 39–42 cilia. Asterisks indicate significance values for Tukey’s multiple comparison test. ****, p ≤0.0001; ***, p ≤ 0.001. D-E. Line scans of NG3BBS5 fluorescence intensities along cilia. IMCD3-[pEF1α-NG3BBS5] cells transfected with the indicated plasmids were either left untreated (D) or treated with SAG (E) for 40 min, fixed, and imaged. Representative images of cilia are shown in insets (see also Fig S4C). Scale bar: 1μm. NG3BBS5 is in fire scale, white crosses mark the location of the basal body, and an arrowhead marks the tip of the cilia. n = 14–20 cilia. F. IMCD3 cells transfected with the indicated plasmids were treated with SAG for 2h, fixed, and stained for acetylated tubulin (acTub; magenta), ubiquitin (Ub, white), and DNA (cyan). The CTS fusions were visualized through the intrinsic fluorescence of GFP (yellow). Scale bars, 5 μm (main panel), 1 μm (inset). G. The fluorescence intensities of ubiquitin in cilia are represented as violin plots. n = 40–55 cilia. Asterisks indicate statistical significance value calculated by one-way ANOVA followed by Tukey’s post hoc test. ****, p ≤ 0.0001.
