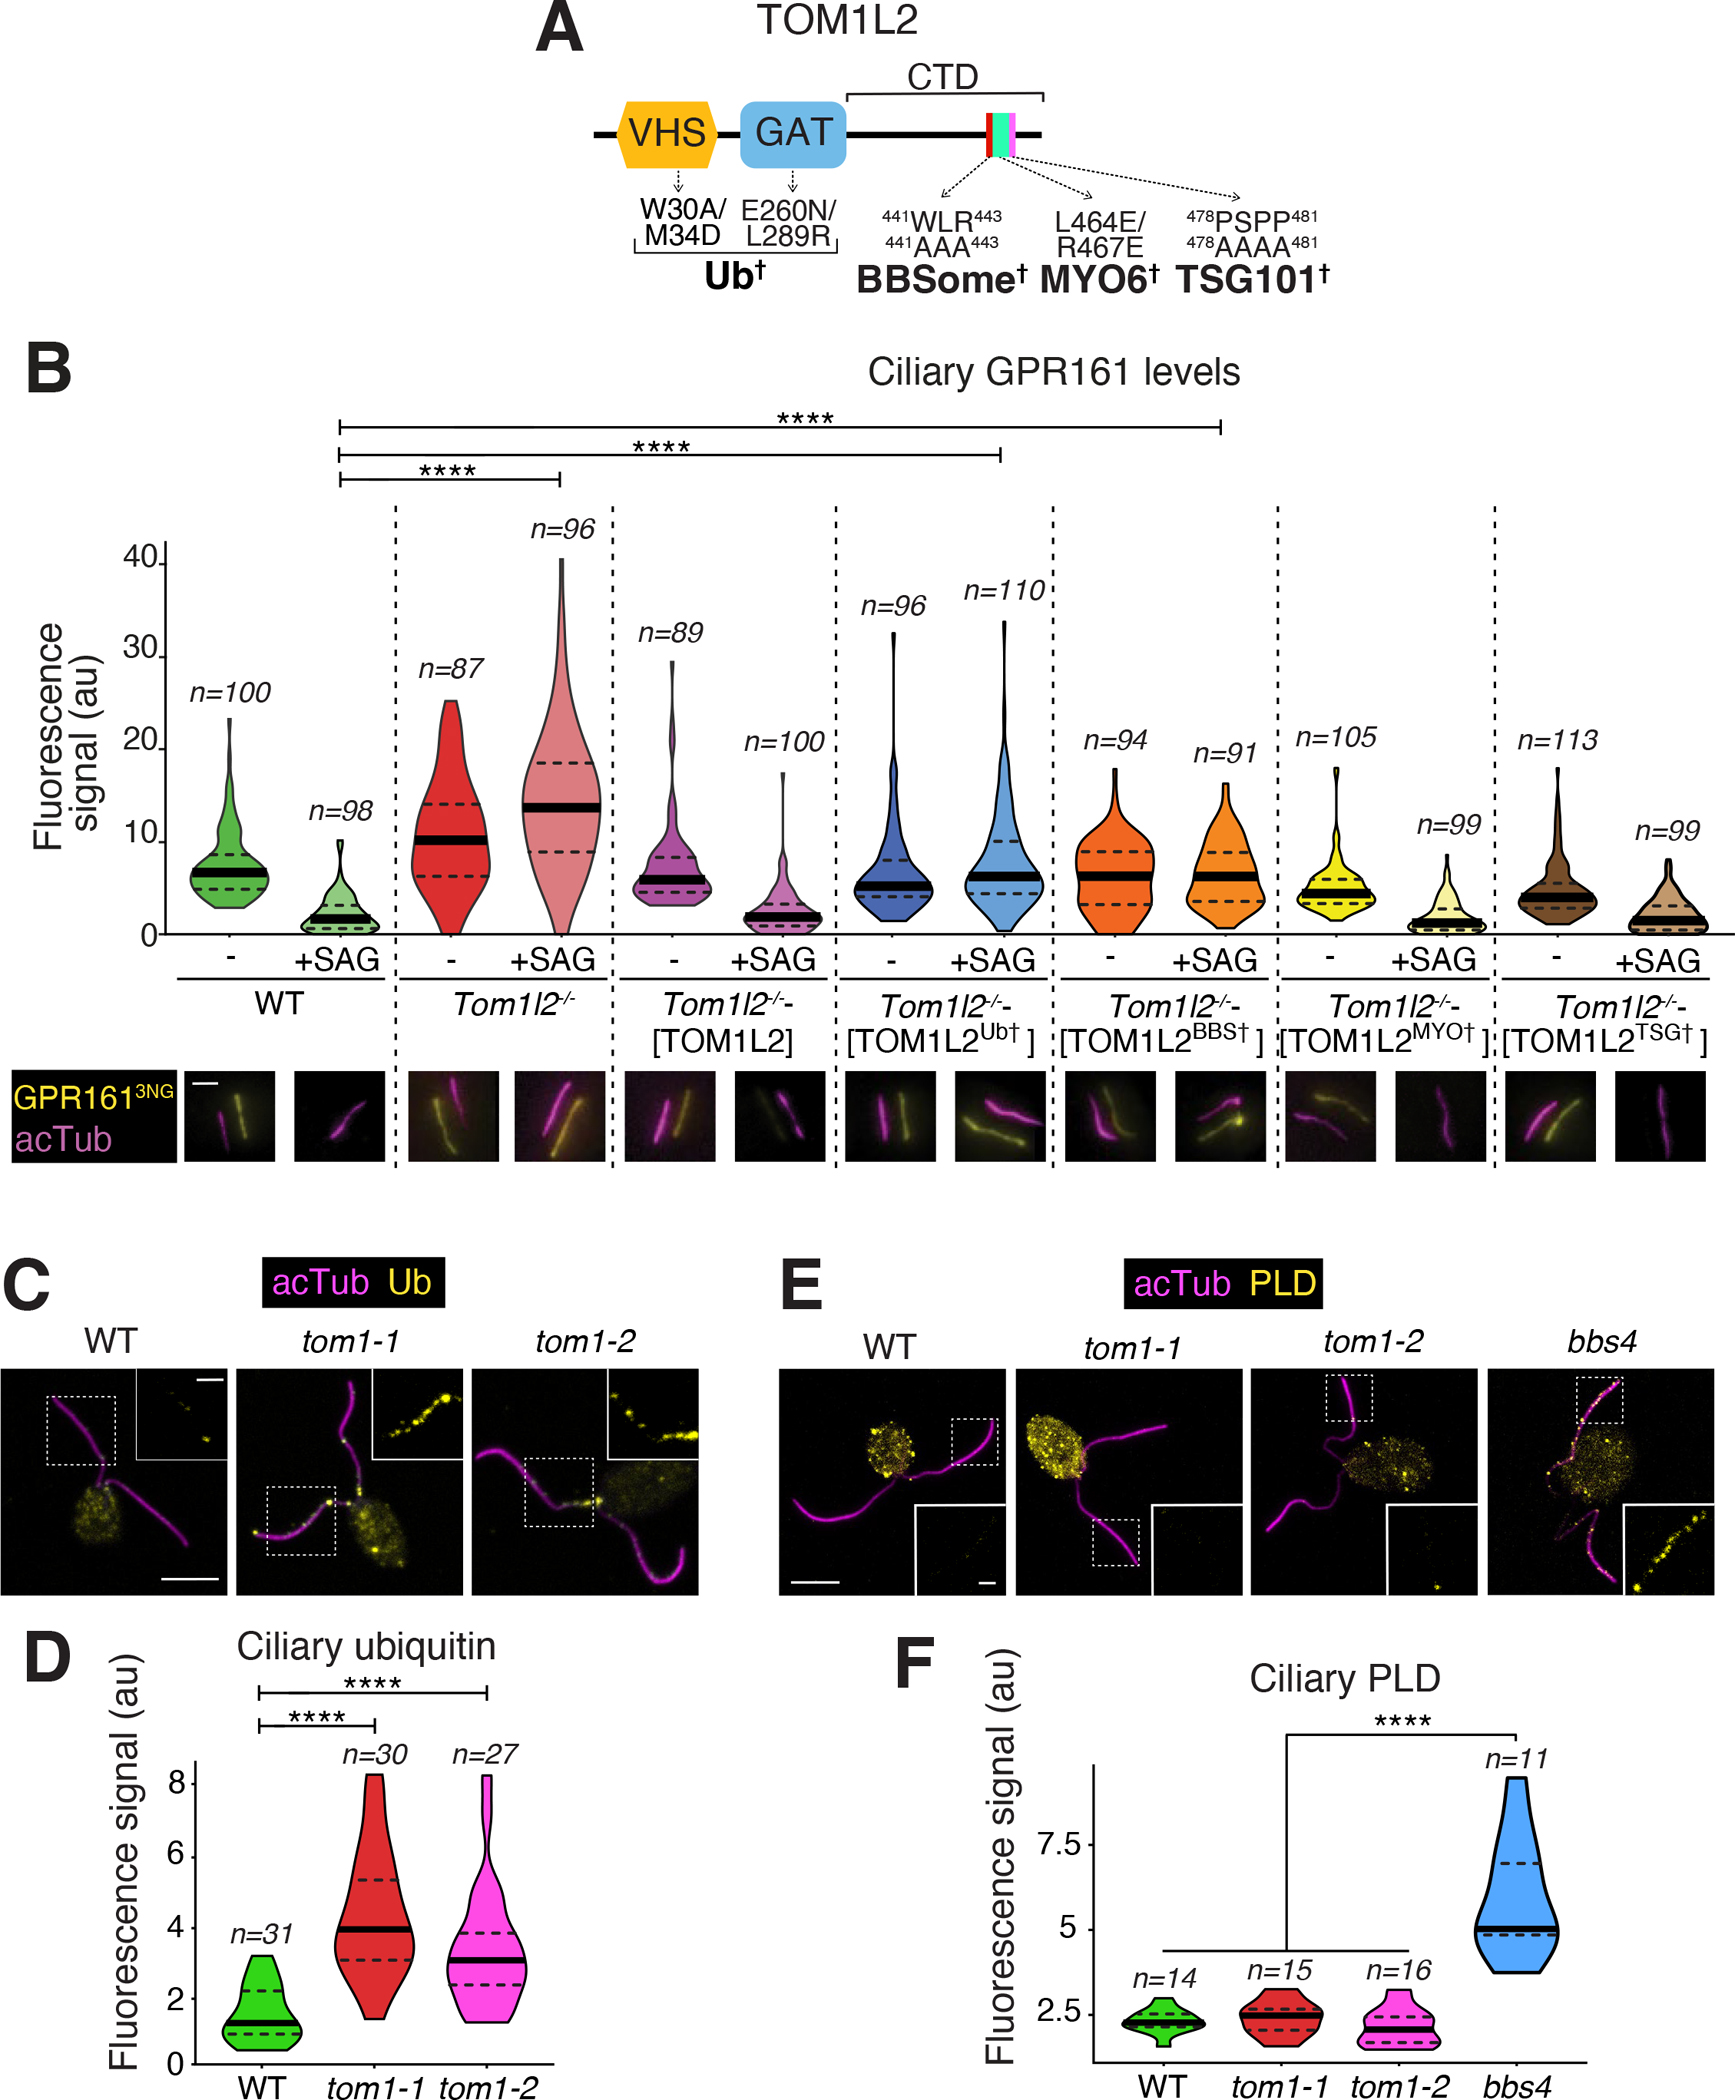
Figure 7. Functional rescue of Tom1l2−/− IMCD3 cells and analysis of Chlamydomonas rheinardtii TOM1 mutants.

A. Diagram of the domain organization of TOM1L2 with point mutations shown to disrupt interactions with the indicated partners. See Fig. S7A–B for variant validation B. TOM1L2 variants defective in interactions with known partners were stably expressed into Tom1l2−/− IMCD3 cells together with GPR161NG3. In wildtype IMCD3 cells, only GPR161NG3 was stably expressed. Cells were treated with SAG or vehicle (DMSO) for 3 h and then fixed and stained for acetylated tubulin (magenta). GPR161NG3 was detected via the intrinsic fluorescence of NeonGreen. Scale bar, 1 μm. The fluorescence intensities of ciliary GPR161NG3 are represented as violin plots. Asterisks indicate statistical significance value calculated by one-way ANOVA followed by Tukey’s post hoc test. ****, p ≤ 0.0001. *, p ≤ 0.05. n= 39–78 cilia.
C. WT or tom1 mutant C. rheinardtii cells were fixed and stained for acetylated tubulin (acTub, magenta) and Ub (yellow). Scale bars, 5 μm (main panel) and 1 μm (inset). D. Violin plots of the ciliary Ub levels in WT and tom1 C. rheinardtii cells. Asterisks indicate statistical significance value calculated by one-way ANOVA followed by Dunnet’s post hoc test. ****, p ≤ 0.0001. The ciliary levels of Ub are increased three to four-fold in tom1 cells as compared with WT. E. C. rheinardtii cells of indicated genotypes were fixed and stained for acetylated tubulin (acTub, magenta) and PLD (yellow). Scale bars, 5 μm (main panel) and 1 μm (inset). F. Violin plots of the ciliary PLD levels in WT or tom1 or bbs4 C. rheinardtii cells. Asterisks indicate statistical significance value calculated by one-way ANOVA followed by Dunnet’s post hoc test. ****, p ≤ 0.0001. The ciliary levels of PLD are increased more than 2.5 fold in bbs4 cells compared to other genotypes.
