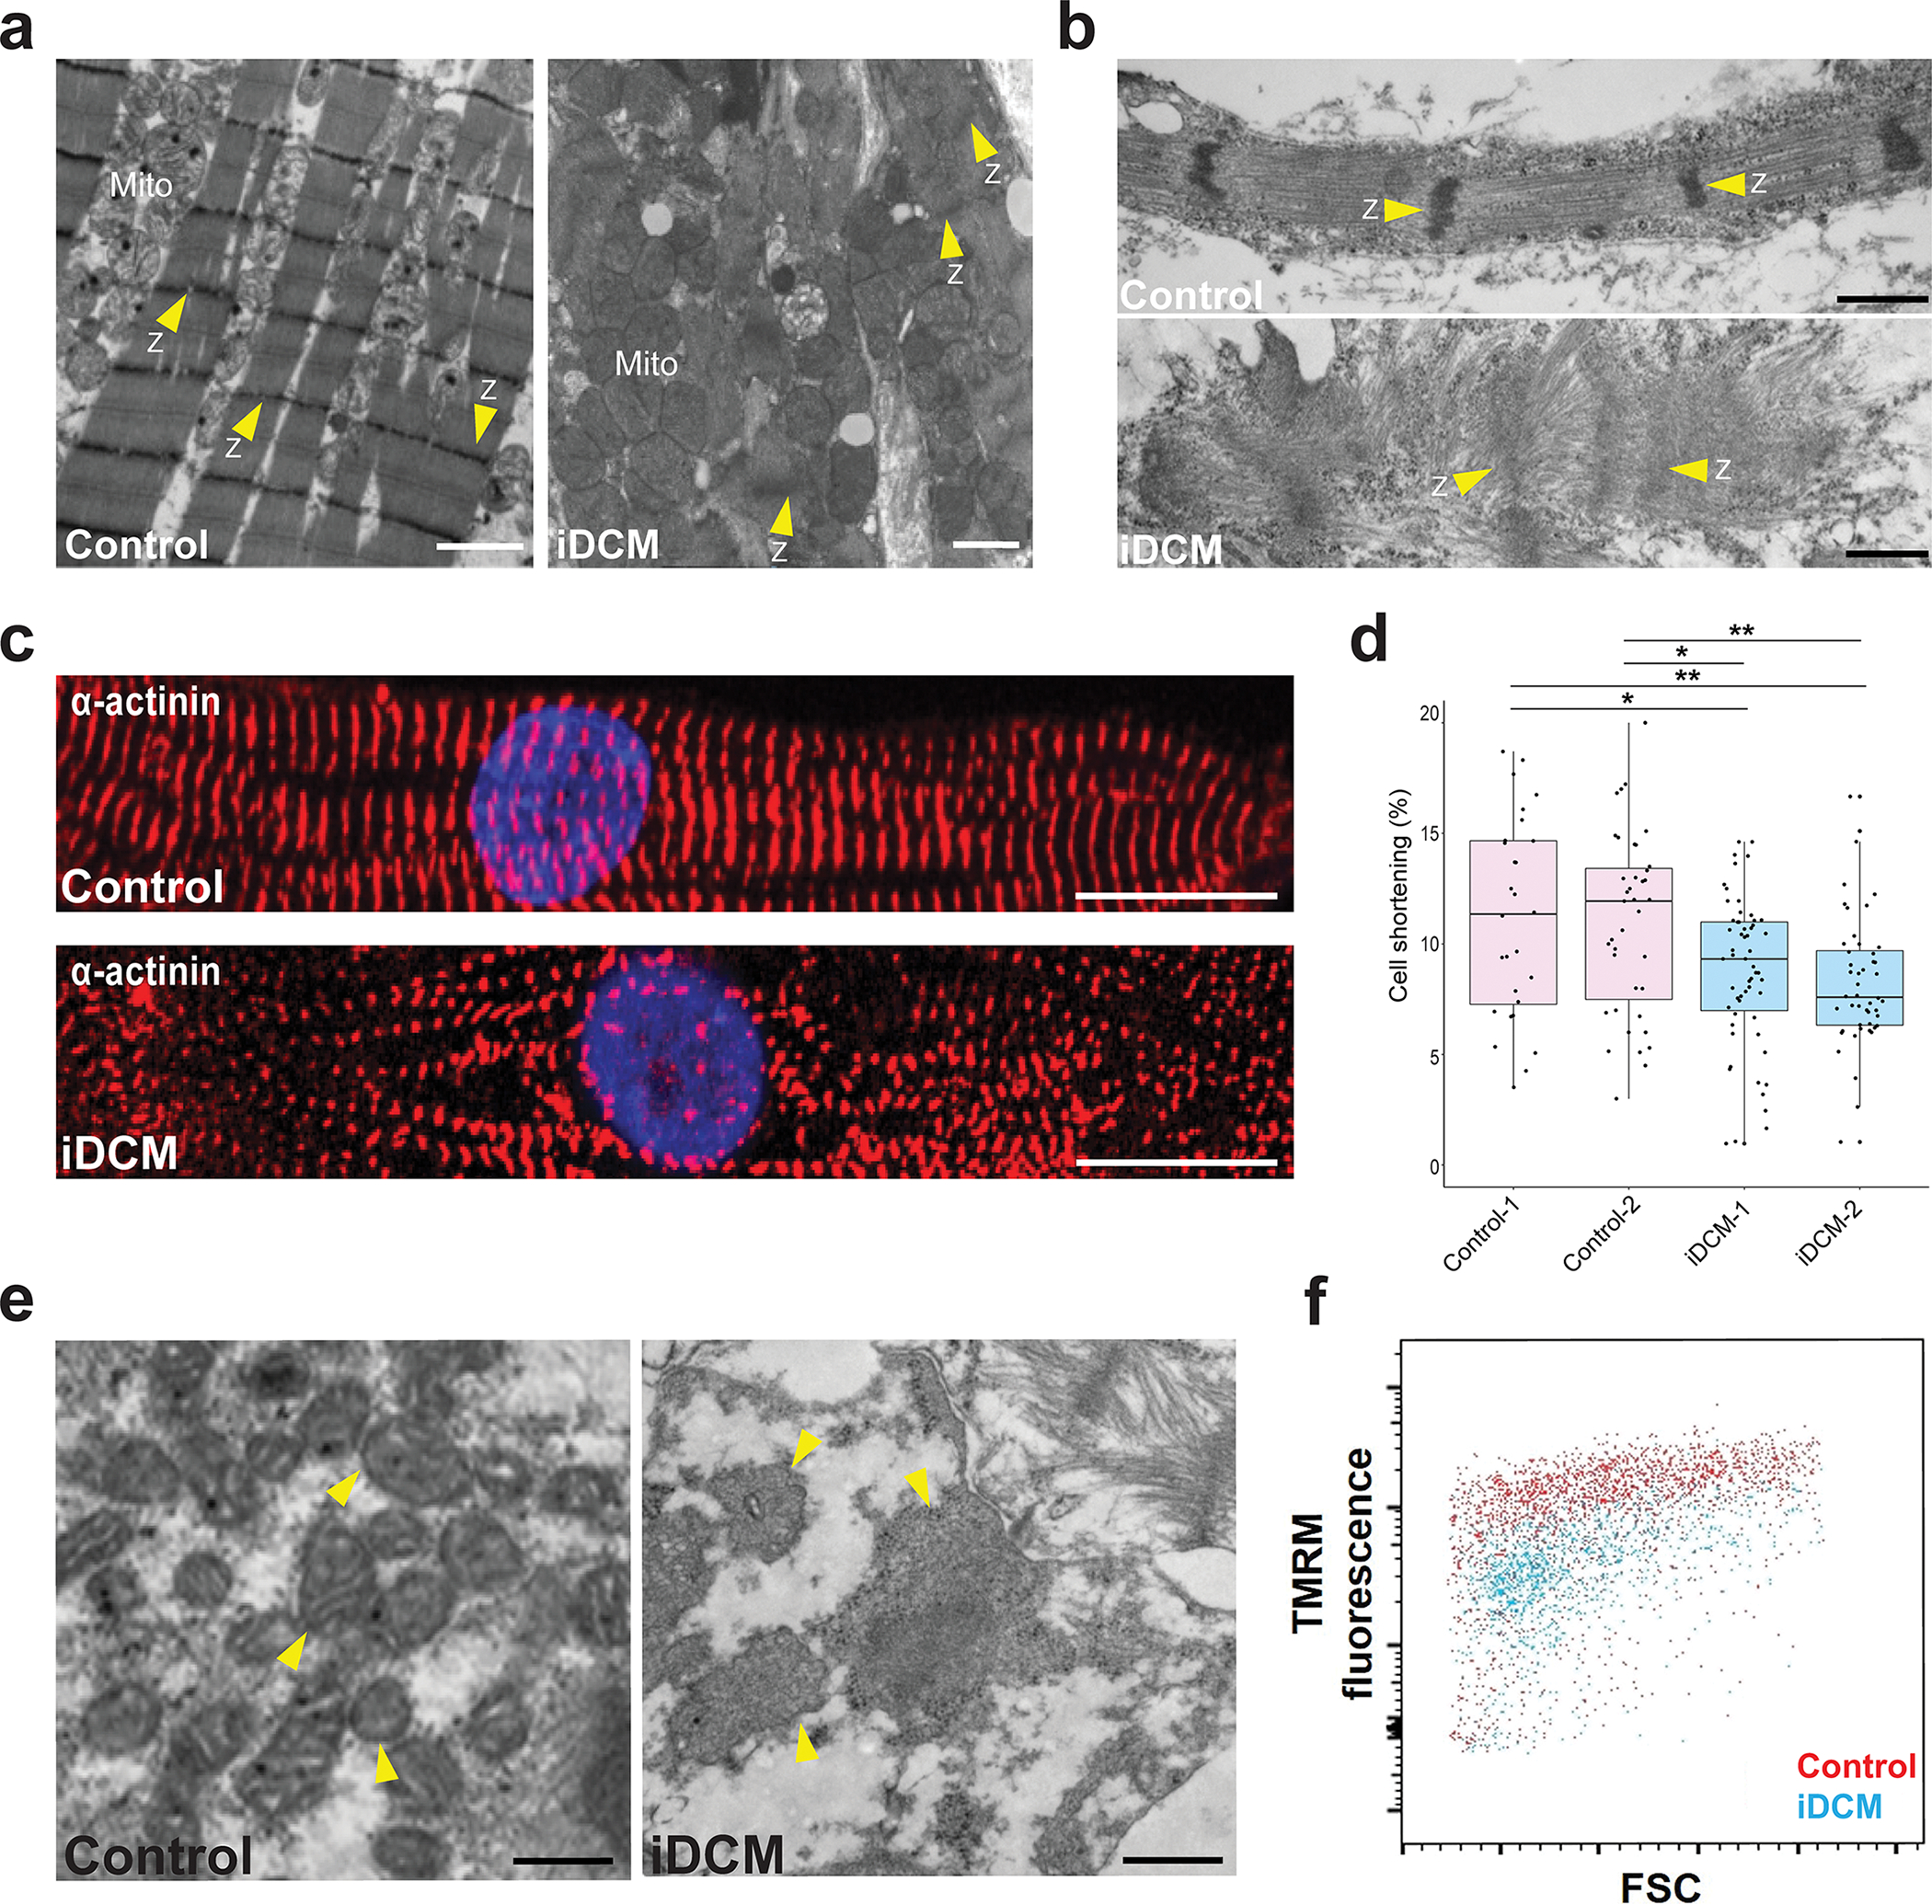
Figure 1. CMs derived from the iDCM patient’s iPSCs recapitulate cardiac defects.

a, TEM images of hearts. Left, TEM of normal heart showing well-organized myofilaments, distinct Z-lines (Z; arrowheads) and mitochondria (Mito) with distinct cristae. Right, EM of the iDCM patient’s heart showing severely disorganized myofibrils with indistinct Z-lines and dysmorphic mitochondria (Mito) without appreciable cristae. Scale bar = 1 μm. b, iPSC-CM from a healthy control exhibiting organized myofilaments with distinct Z-lines (Z; arrowheads) (top), whereas the iPSC-CM derived from the iDCM patient (bottom) exhibit disorganized myofibrils without distinct Z-lines (Z). Scale bar = 0.5 μm. c, Representative immunofluorescence images of α-actinin staining of control (top) and iDCM (bottom) CMs. Scale bar = 10 μm. d, Compared with control-CMs derived from 2 independent healthy control iPSC lines (Control-1, −2), iDCM-CMs from 2 independent iPSC lines (iDCM-1, −2) exhibited significantly reduced cell shortening (~11% vs ~8%). p value by one-way ANOVA and post-hoc Tukey *p < 0.01, **p < 0.05. n = 28 Control 1-CMs, 39 Control 2-CMs, 59 iDCM 1-CMs, 48 iDCM 2-CMs. Center line = median; whiskers = 1.5IQR. e, TEM images of iPSC-CMs focused on mitochondria. Left, mitochondria of control iPSC-CMs are easily distinguishable and have distinct cristae, whereas mitochondria (arrowheads) from iDCM-CMs appear larger and swollen, without clear cristae. Scale bar = 0.5 μm. f, Fluorescence-activated cell sorting analysis demonstrating that iDCM-CMs have quantitatively lower TMRM uptake and hence lower mitochondrial membrane potentials than control iPSC-CMs. TEM images of CMs were acquired at 45 days of differentiation. Other studies were done at 35 days of differentiation.
