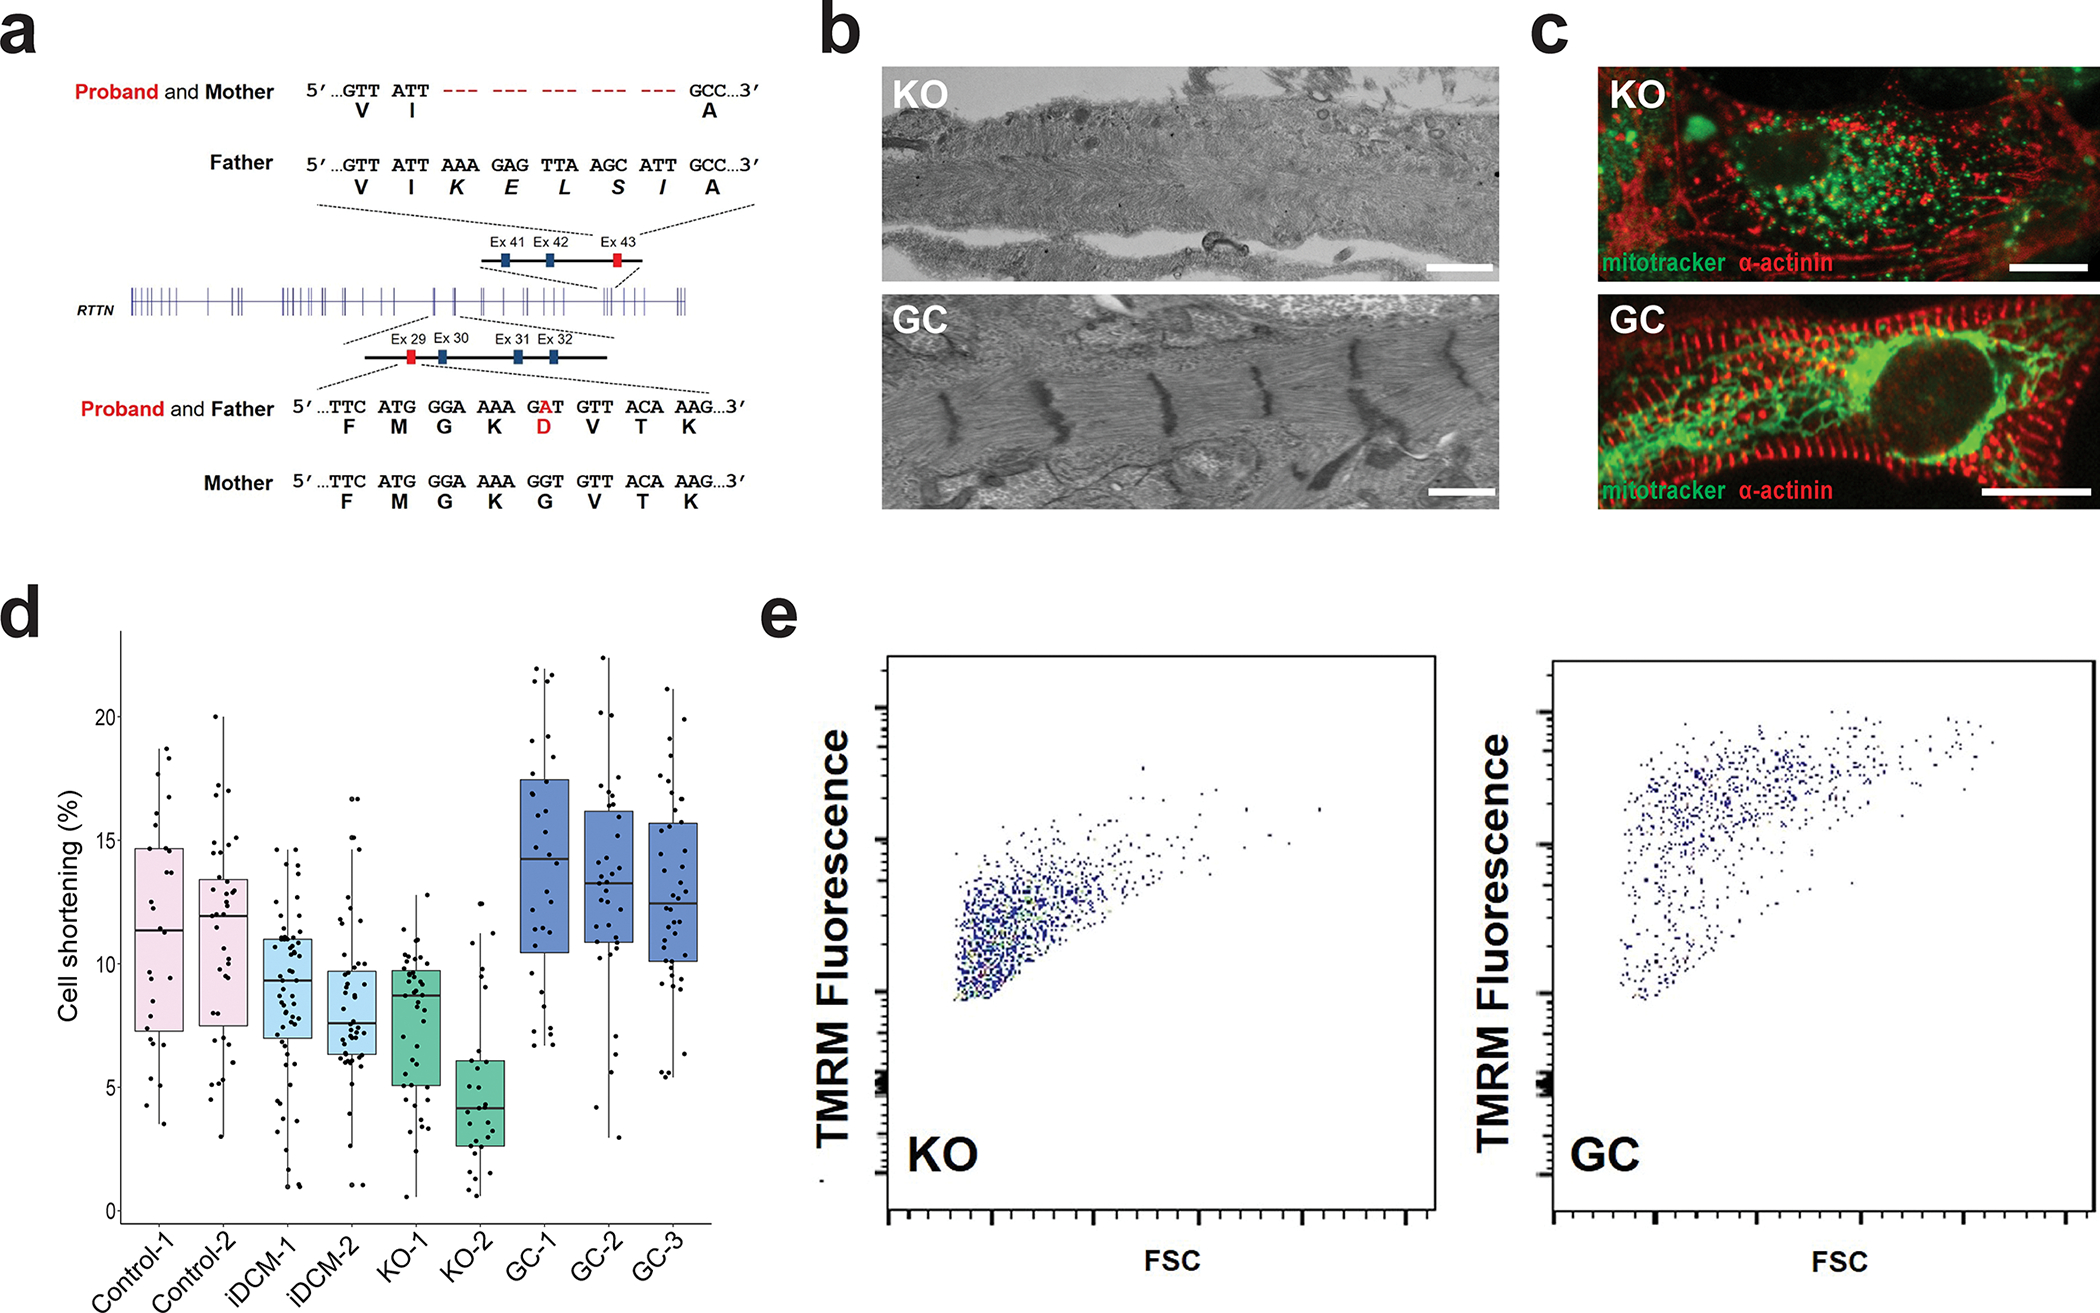
Figure 2. Compound heterozygous mutations in RTTN lead to iDCM phenotype.

a, Whole-exome sequencing of the proband and his parents revealed that the patient was a compound heterozygote for a G1321D missense mutation from the father and an in-frame deletion (p.1921–1925) from the mother. b, RTTN knockout (KO) CMs displayed disorganized myofibrils with indistinct Z-lines (top), whereas the RTTN gene-corrected (GC) CMs (bottom) appear similar to the healthy control-CMs seen in Figure 1b. Scale bar = 0.5 μm. c, RTTN KO-CMs (top) displayed globular or punctate mitochondria, as visualized by MitoTracker (green), and disorganized myofilaments, as visualized by α-actinin staining (red). By contrast, RTTN GC-CMs (bottom) displayed networks of elongated mitochondria (green) and organized myofilaments, similar to healthy control-CMs. Scale bar = 20 μm. d, RTTN KO-CMs from two independent KO lines (KO-1, −2) displayed reduced cell shortening similar to the iDCM-CMs. By contrast, RTTN GC-CMs from three isogenic GC lines (GC-1, −2, −3) displayed restored shortening, comparable to healthy control-CMs. n = 28 Control 1-CMs, 39 Control 2-CMs, 59 iDCM 1-CMs, 48 iDCM 2-CMs, 43 KO 1-CMs, 29 KO 2-CMs, 32 GC 1-CMs, 35 GC 2-CMs. Center line = median; whiskers = 1.5IQR. e, FACS analysis of TMRM staining demonstrating reduced mitochondrial membrane potential in RTTN KO-CMs and restored mitochondrial membrane potential in RTTN GC-CMs.
