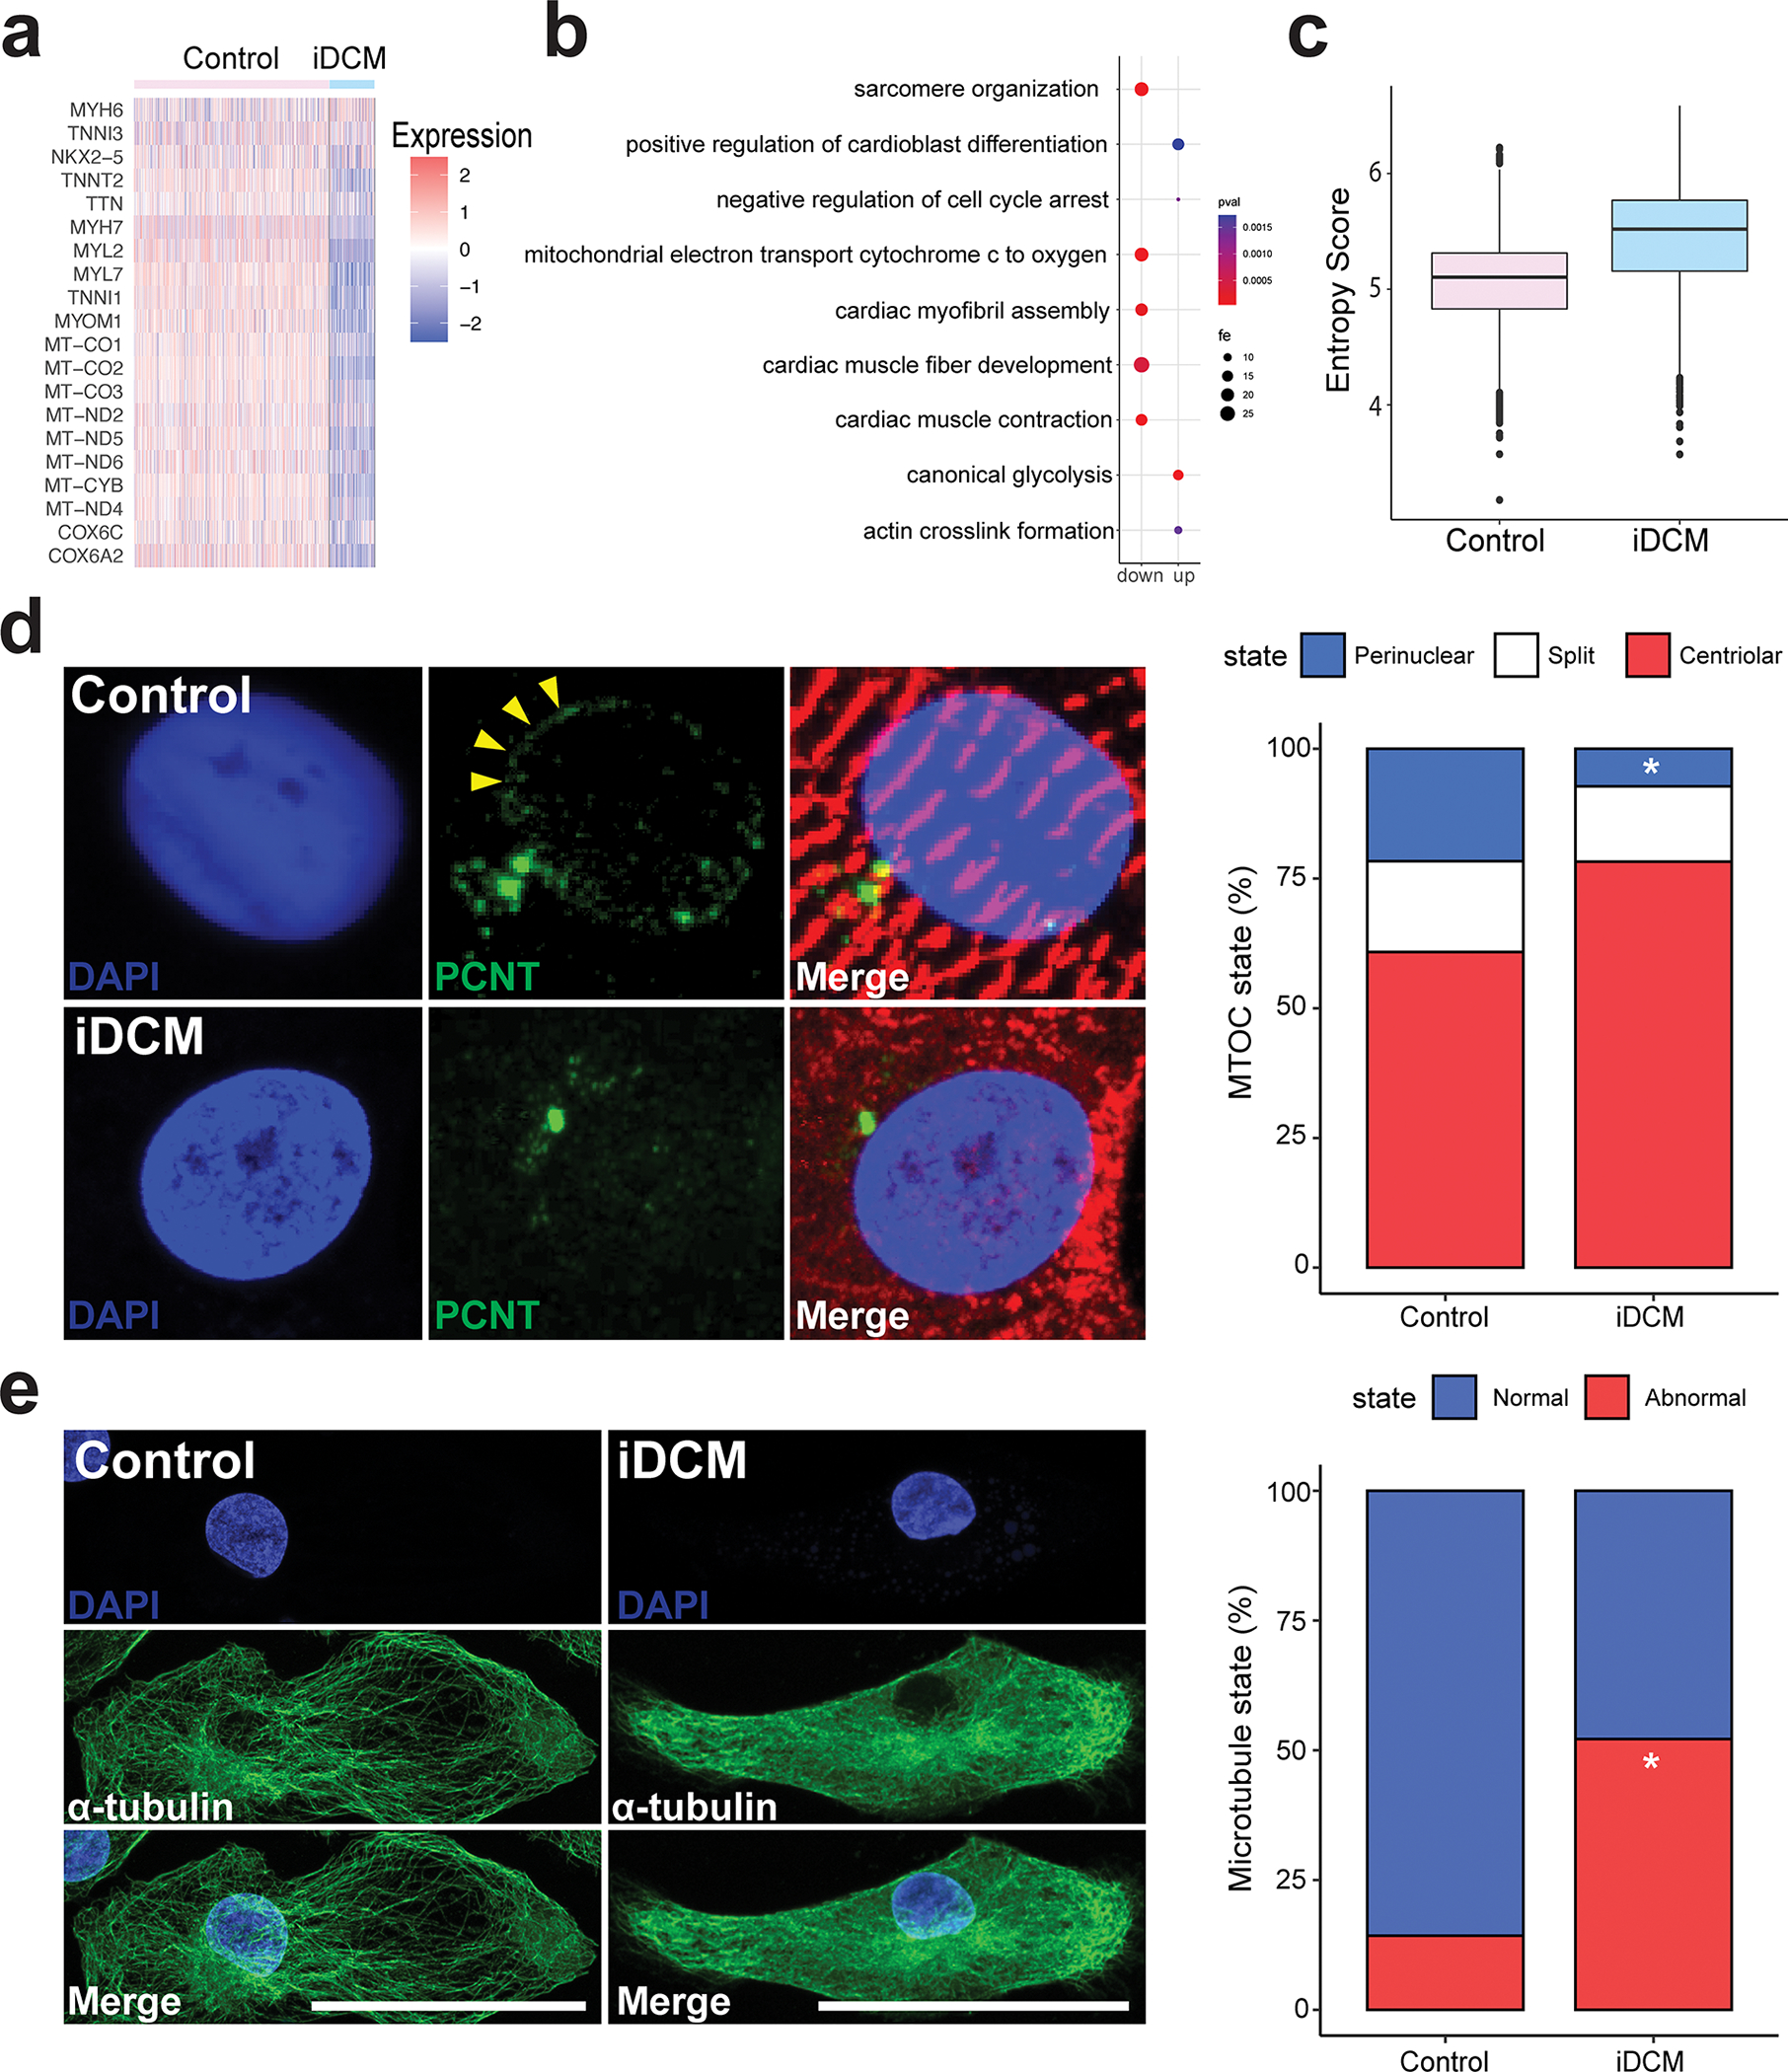
Figure 4. RTTN mutation leads to impaired maturation via disrupted reorganization of the centrosome and microtubule network formation.

a, Heat map showing expression of genes related to CM maturation in control and iDCM-CMs. b, Dot plot of fold enrichment (fe) of gene ontology (GO) pathways. up = upregulated in iDCMs; down = downregulated in iDCMs. c, Shannon entropy score showing relative maturation score of control and iDCM-CMs. d, Top, In the control CM with a normally organized sarcomere (α-actinin, red), PCNT (green) is redistributed to the perinuclear region (arrowheads). Bottom, In the RTTN mutant (iDCM) CM with a disorganized sarcomere (α-actinin, red), PCNT (green) remains localized to the centrosome. Quantification of PCNT distribution in D36 control and iDCM-CMs by a blinded observer with categories of centriolar, split, or perinuclear. PCNT was perinuclear in 21.65% of control-CMs, whereas it was perinuclear in only 7.26% of iDCM-CMs. Perinuclear vs centriolar p = 0.0021 by two-tailed Fisher’s exact test. n = 97 control-CMs, 124 iDCM-CMs. e, Left, Control CM displaying a prominent network of thick microtubule (MT) fibers (α-tubulin, green) emanating from the perinuclear region, with an organized sarcomere (cardiac TnT, red). Right, by contrast, iDCM CM displayed thinner, shorter and fainter MT fibers without a clear organizing center, and a disorganized sarcomere. Quantification of CMs with grossly normal and abnormal MT network by a blinded observer. The MT network was grossly normal in 86% of control-CMs, whereas only 48% of iDCM-CMs had normal MT networks. n= 28 Control-CMs, 23 iDCM-CMs. p=0.006 by two-tailed Fisher’s exact test. Scale bar = 50 μm.
