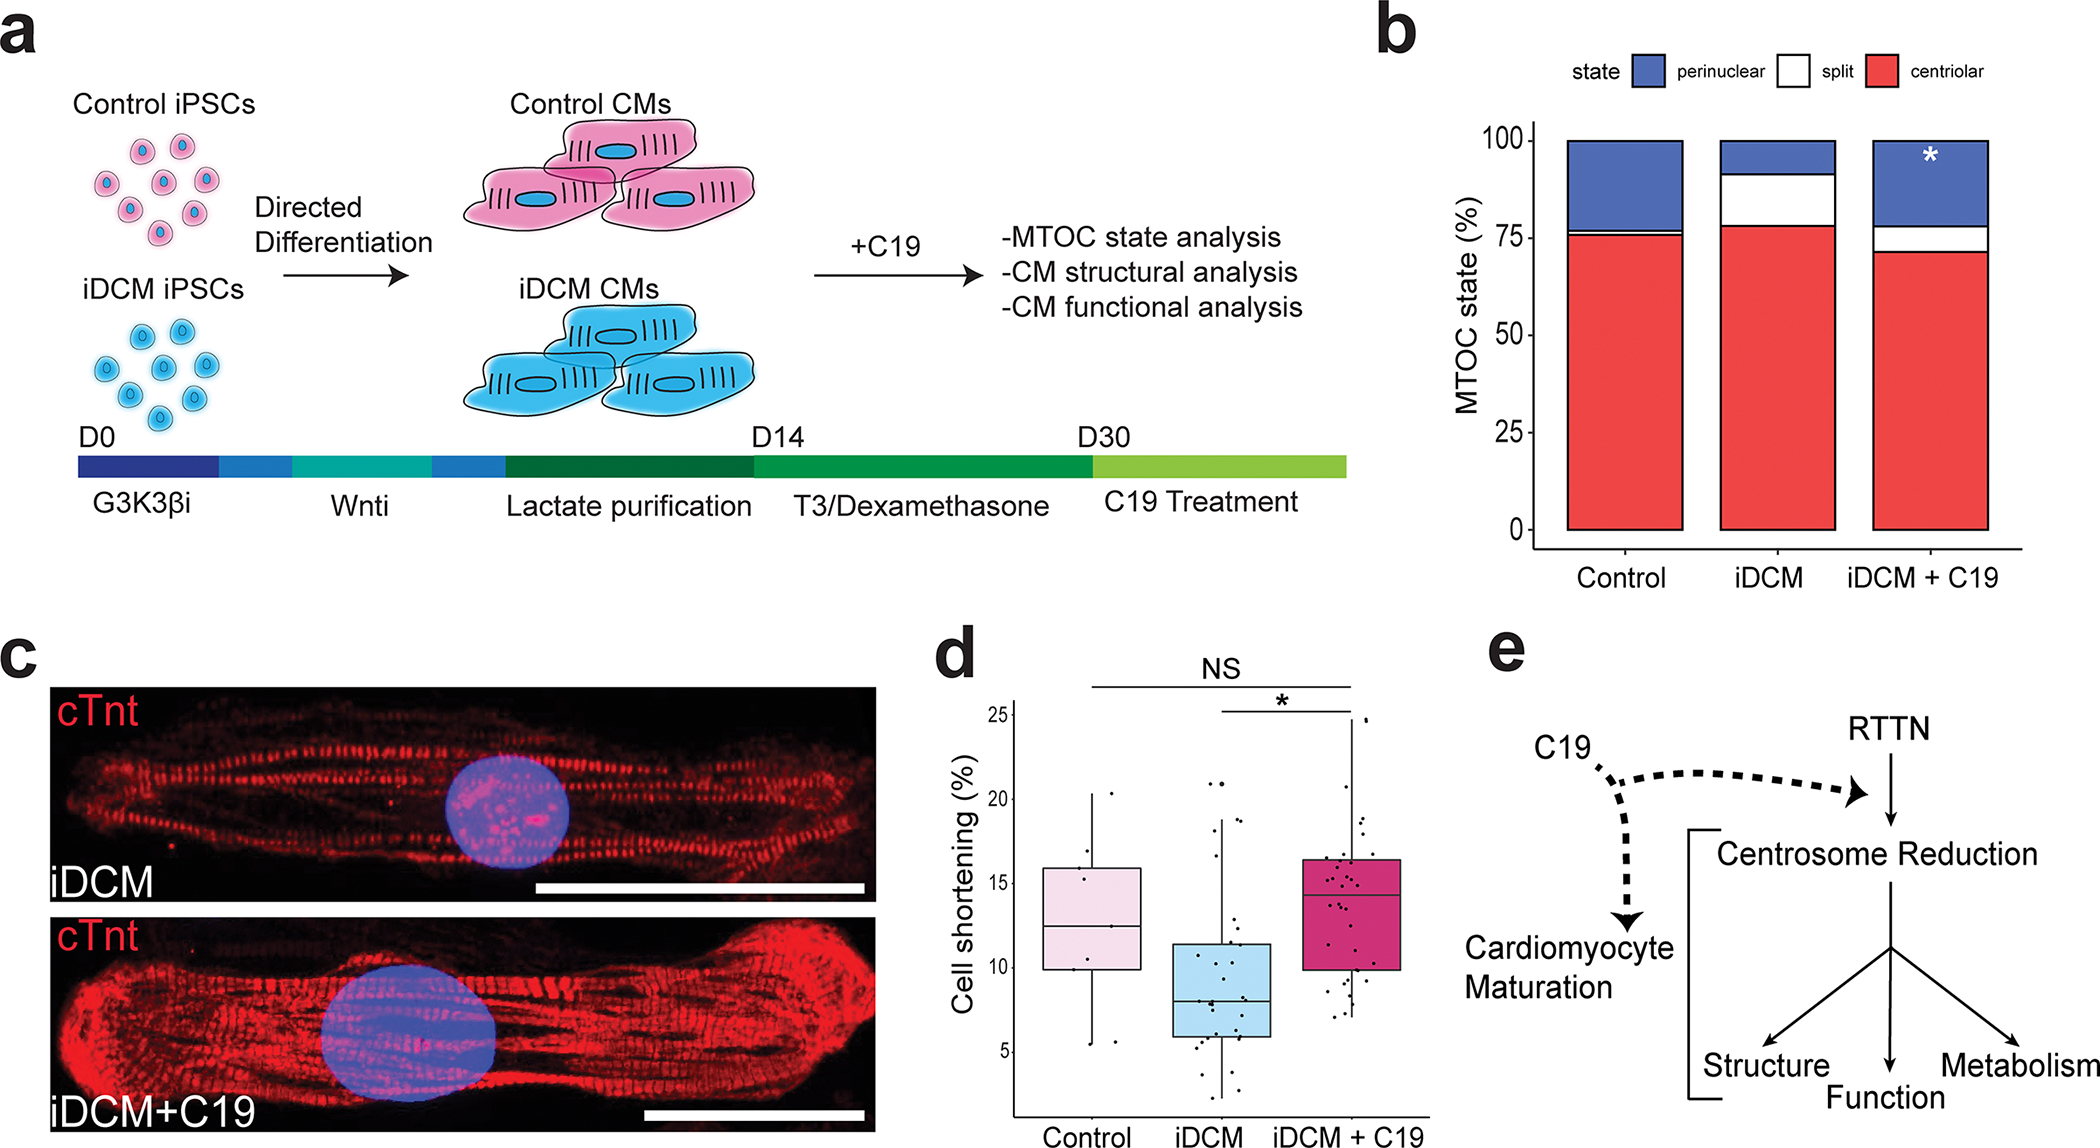
Figure 5. Pharmacological treatment to induce centrosomal reorganization restores CM structure and function in iDCM.

a, Schematic detailing C19 treatment at differentiation day 30 (d30) control-CMs and iDCM-CMs. b, Quantification of centriolar, split, and perinuclear MTOC localization in D32 CMs by a blinded observer. PCNT was perinuclear in 23.1% of control-CMs, 7.6% of iDCM-CMs, and 23.6% of iDCM+C19 CMs. p = 0.0082 by Fisher Exact test. c, Representative images of untreated iDCM-CMs (top) and iDCM-CMs treated with C19, which showed increased levels of sarcomere formation. Scale bar = 50 μm. d, Boxplots showing % cell shortening in control, D40 iDCM, and iDCM C19 treated CMs. n = 9 control, 32 iDCM, 36 iDCM + C19 from two differentiations. p value = 0.0006 by one-way ANOVA. Post hoc Tukey correction p value of iDCM vs iDCM + C19 = 0.001, control vs iDCM + C19 = 0.682 (NS). Center line = median; whiskers = 1.5IQR. e, Working model of CM maturation cascade showing RTTN-mediated centrosome reduction is upstream of other canonical maturation events.
