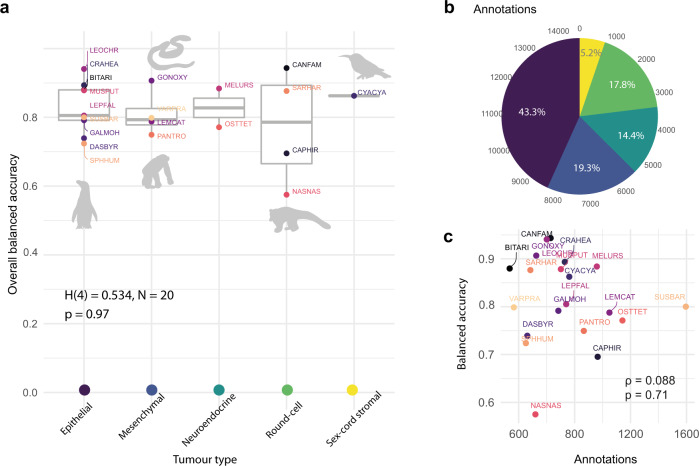
Fig. 2. AI single-cell prediction comparison across tumour types.
Balanced accuracy is computed as the average of sensitivity and specificity, ‘overall’ refers to the average of cancer, stromal and lymphocyte cells. a A Kruskal–Wallis test, n = 20, was used to compare the overall balanced accuracy between tumour types. Thick horizontal lines indicate the median value, outliers are indicated by the extreme points, the first and third quantiles are represented by the box edges, and vertical lines indicate minimum and maximum values. b Distribution of the number of annotations by tumour type (colours correspond to tumour types in a). c Relationship between the number of annotations and the overall balanced accuracy for each species (n = 20) using a Spearman’s correlation. Species in (a) and (c) are labelled with their codes; for more information, see Table 1.

