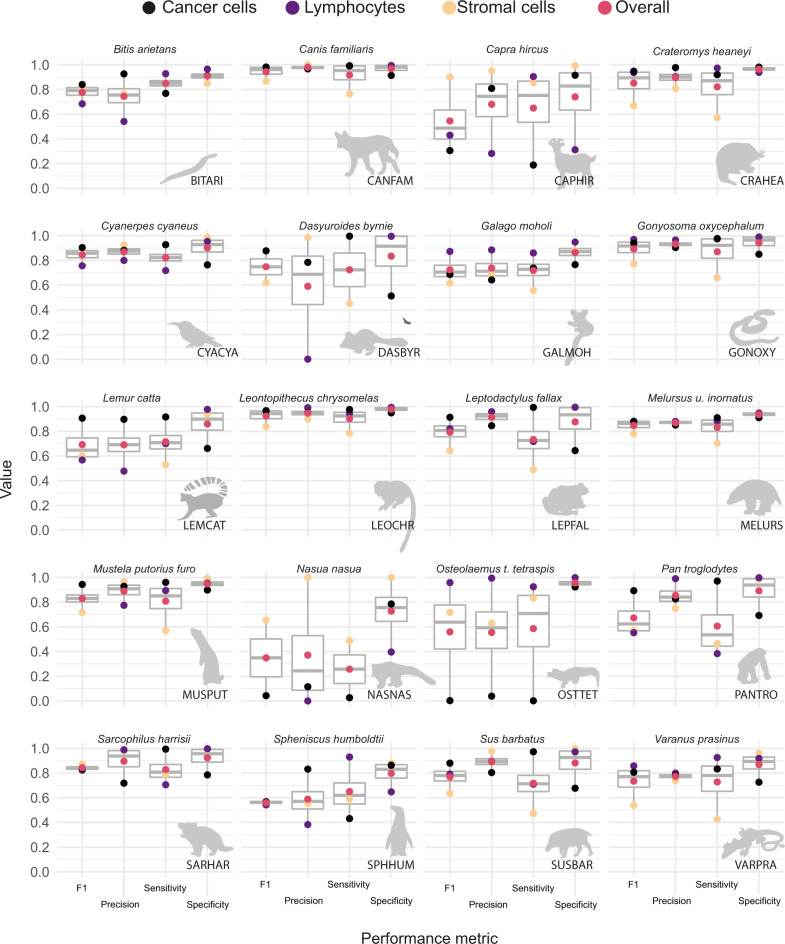
Fig. 3. AI model prediction performance metrics for 20 species.
For each species, four metrics were evaluated, including F1, precision, sensitivity, and specificity (as labelled on the x-axis) for the prediction accuracy of cancer, lymphocytes, and stromal cells, as well as their average shown as ‘overall’ (as denoted with colours on the top x-axis). For species codes, see Table 1. For the number of cells annotated per cell class for each species, see Supplementary Table 1. Thick horizontal lines indicate the median value, outliers are indicated by the extreme points, the first and third quantiles are represented by the box edges and vertical lines indicate minimum and maximum values.

