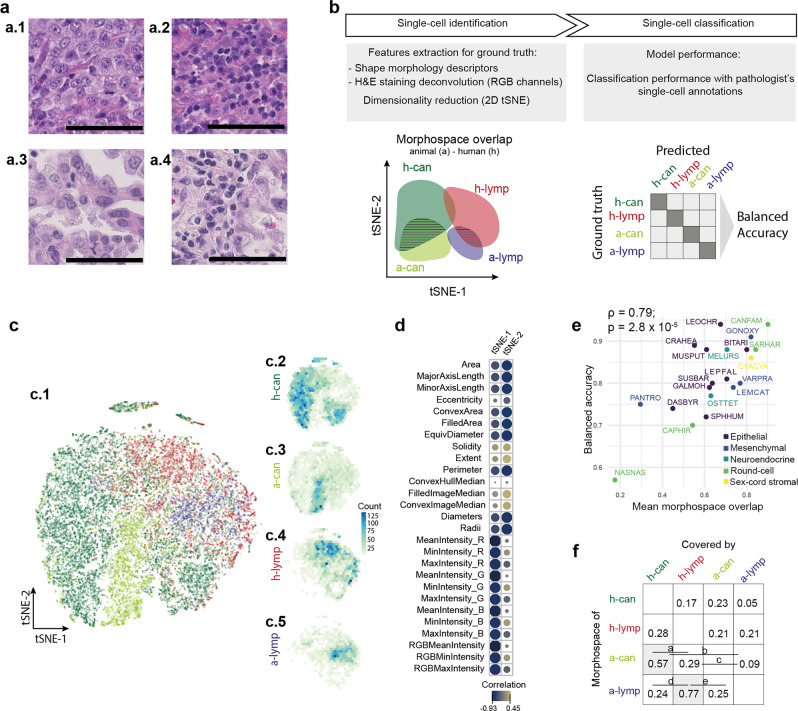
Fig. 4. Overlap across the morphological space.
a Canine (a.1, a.2) and human cells (a.3, a.4) have visible morphological similarities even for non-specific stainings such as hematoxylin and eosin across cancer cells (a.1, a.3) and immune cells (a.2, a.4). Scale bar = 50 µm. b Explanation of the morphospace overlap score based on feature extraction of single cells annotated by pathologists, human (h-) and animal (a-) cancer cells (can) and lymphocytes (lymp). c Dimensionality reduction enables the evaluation of morphospace overlap across human (c.2, c.3) and non-human cells (c.4, c.5). d The t-SNE dimensions show explainable cell features associated with staining and morphology (see Supplementary Table 4). e Model accuracy correlates with the mean morphospace overlap for each sample in cohort 0 (Spearman’s correlation, n = 20). f Mean values of morphospace overlap between human and animal cells across all the 20 samples of the cohort 0. Animal lymphocytes (a-lymp) and cancer cells (a-can) have the highest morphospace overlap with human lymphocytes (h-lymp) and cancer cells (h-can), respectively (shadowed cells in the matrix). Letters indicate only statistically significant comparisons, row-wise, after multiple comparison with Benjamini & Hochberg correction (p values: a = 0.0004, b = 5.4 × 10⁻⁹, c = 0.0006, d = 6.4 × 10⁻⁸, e = 3 × 10⁻⁶).

