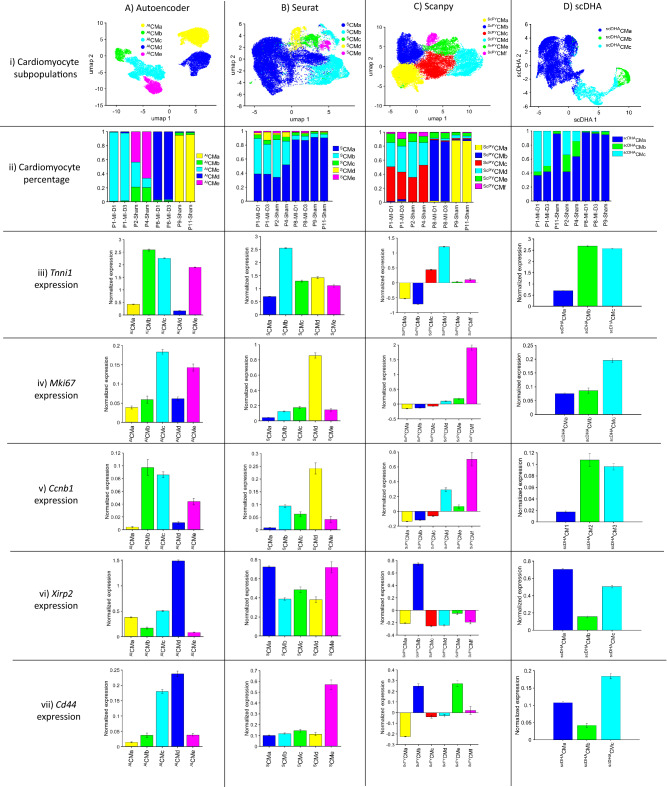
Figure 3.
AI Autoencoder was more effective than non-AI tools for cluster analysis of cardiomyocyte scRNAseq data from mouse hearts. Cluster analysis of cardiomyocyte scRNAseq data was conducted via (A) AI Autoencoder (clusters AICMa-AICMe), (B) Seurat (cluster SCMa-SCMe), (C) ScanPY (clusters ScPYCMa-ScPYCMf), or (D) scDHA (cluster scDHACMa-scDHACMc) and displayed via (Row i) UMAP for identification of cardiomyocyte subpopulations. (Row ii) The proportion of cardiomyocytes from each cluster is displayed for each injury group and time point. (Rows iii-vii) The expression of (iii) Tnni1, (iv) Mki67, (v) Ccnb1, (vi) Xirp2, and (vii) Cd44 was quantified for each cardiomyocyte cluster. Similarities between cluster labels are coincidental (e.g., clusters AICMa, SCMa, and ScPYCMa do not represent the same subpopulation). Expression data were normalized as in Seurat, briefly: the raw counts were logarithm (base 2) transformed and scaled according to the total of UMIs and detected genes per cell.

