Figure 5.
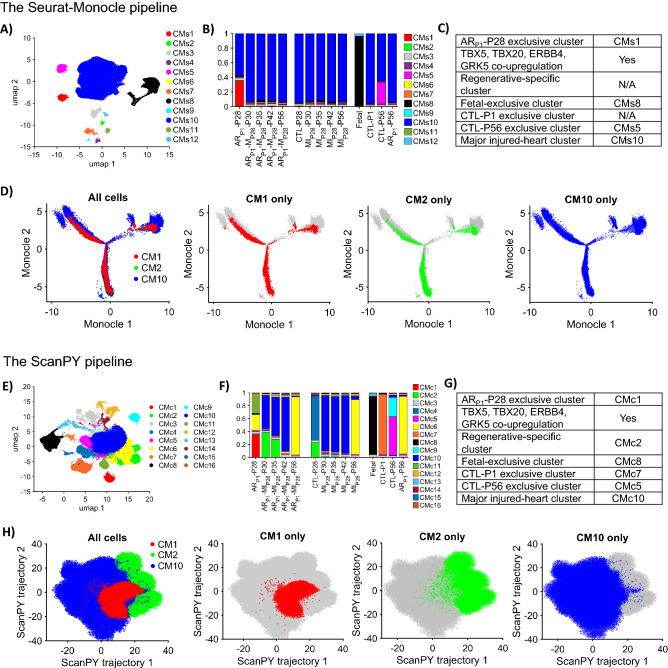
AI semisupervised learning was more effective than non-AI tools for trajectory analysis of cardiomyocyte scRNAseq data from pig hearts (A) Seurat-Monocle pipeline UMAP plot visualizing 12 cardiomyocyte clusters (CMs1-CMs12), where these clusters were identified by Seurat pipeline30. (B) The proportion of cardiomyocytes from each cluster CMs1-CMs12 is displayed for each injury group and time point. (C) Summary of clusters resulting from the Seurat-Monocle pipeline that are: exclusive for ARp1-P28, Fetal, CTL-P1, CTL-P56, and co-upregulation of TBX5/TBX20/ERBB4/GRK5, which do not show any clusters explicit for ARP1-MIP28 cardiomyocytes on P30, P35, and P42. (D) Seurat-Monocle pipeline trajectory plot among CM1, CM2, and CM10, whereas CM1, CM2, and CM10 were defined in40. (E) ScanPY pipeline UMAP plot visualizing 16 cardiomyocyte clusters (CMc1-CMc16) identified by ScanPY. (F) The proportion of cardiomyocytes from each cluster CMc1-CMc12 is displayed for each injury group and time point. (G) ScanPY pipeline, a summary of clusters that are: exclusive for ARp1-P28, Fetal, CTL-P1, CTL-P56, and co-upregulation of TBX5/TBX20/ERBB4/GRK5. (H) ScanPY pipeline trajectory plot among CM1, CM2, and CM10. For comparison, the figures for the AI-based method were available at40.

