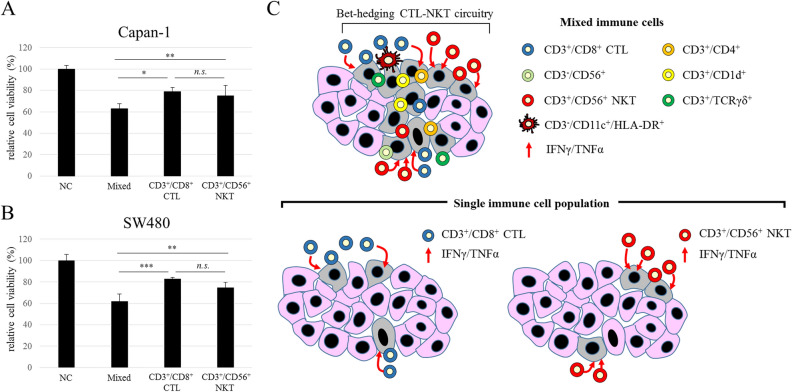
Figure 5.
Comparison of cytotoxicity of mixed immune cells and single-cell populations. Cytotoxicity of mixed immune cells and single cell populations of CD3+/CD8+ CTLs and CD3+/CD56+ NKT cells against (A) Capan-1 and (B) SW480 cells (E:T ratio = 10:1, n = 4). The data are shown as means ± SD. n.s. not significant. *p < 0.01, **p < 0.05, ***p < 0.0005 (one-way ANOVA with Tukey analysis). (C) Diagram of tumor cell-killing activity of mixed immune cells and single-cell populations.

