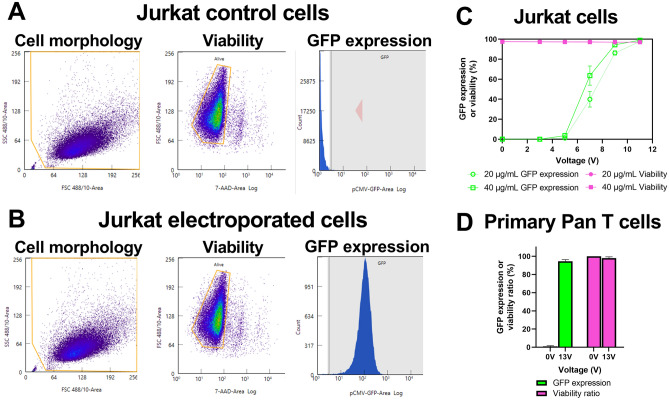
Figure 3.
Delivery of mRNA encoding GFP to Jurkat and primary T cells. (A) Representative flow cytometry plots from zero voltage-control or (B) electroporated Jurkat cells depicting cell morphology, viability, and GFP expression. (C) Impact of varying waveform voltage amplitude on delivery using 20 or 40 µg/mL mRNA to Jurkat cells (n = 3). (D) High efficiency delivery using 40 µg/mL mRNA for primary T cells from four healthy donors (n = 4). Data shown as mean ± standard deviation (C,D). Some error bars are too small to be visible (C).

