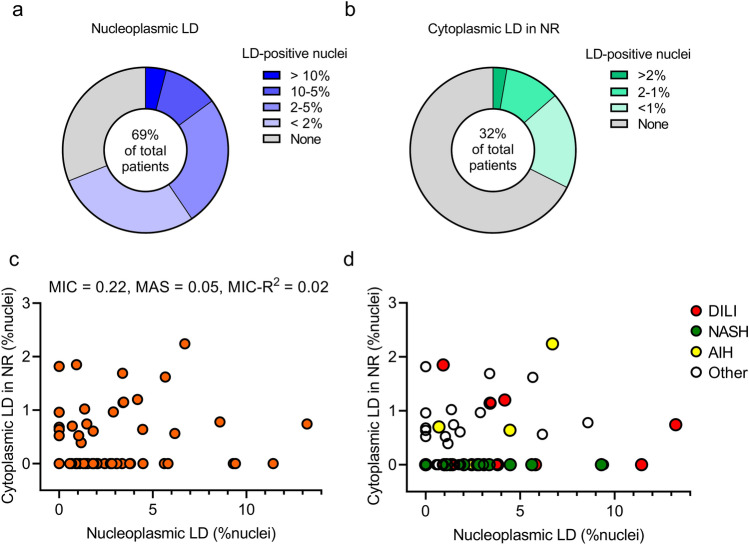
Figure 2.
Frequencies and correlations of nLDs and cLDs in NR. The study included 80 patients who underwent liver biopsy. A part of each liver biopsy specimen was dissected and fixed for electron microscopy observation. Six patients were excluded from analysis because the electron microscopy sample did not contain the corresponding background liver specimen. The frequencies of nLDs and cLDs in NR were determined by counting > 100 nuclei per specimen. (a) Frequency of nLDs in liver biopsy samples. (b) Frequency of cLDs in NR in liver biopsy samples. (c,d) Scatter plot showing a correlation between nLD and cLD in NR frequencies. Correlations were analyzed using the MINE method that captures a wide range of associations, functional and otherwise. AIH autoimmune hepatitis, cLDs in NR cytoplasmic lipid droplets in the nucleoplasmic reticulum, DILI drug-induced liver injury, MAS maximum asymmetry score, MIC maximal information coefficient, MINE maximal information-based nonparametric exploration, NASH nonalcoholic steatohepatitis, nLDs nucleoplasmic lipid droplets.

