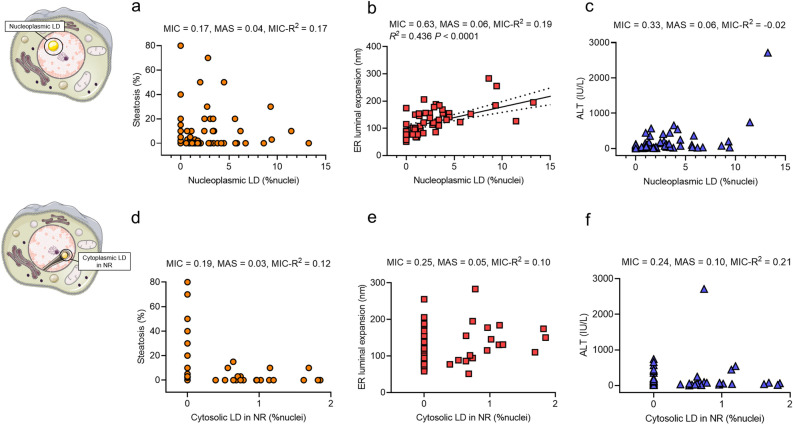
Figure 3.
Correlation of nLDs and cLDs in NR with clinical parameters. Correlations were assessed in data from 74 patients who had observable liver specimens in electron microscopy. (a–c) Scatter plots showing the correlation between frequencies of nLDs and hepatic steatosis, ER luminal expansion, and plasma level of ALT. Correlations were analyzed by using the MINE method. The black line depicts linear regression; the dotted line shows the 95% confidential intervals. (d–f) Scatter plots showing the correlation between frequencies of cLDs in NR and hepatic steatosis, ER luminal expansion, and plasma level of ALT. ALT alanine aminotransferase, cLDs in NR cytoplasmic lipid droplets in the nucleoplasmic reticulum, ER endoplasmic reticulum, MAS maximum asymmetry score, MIC maximal information coefficient, MINE maximal information-based nonparametric exploration, nLDs nucleoplasmic lipid droplets.

