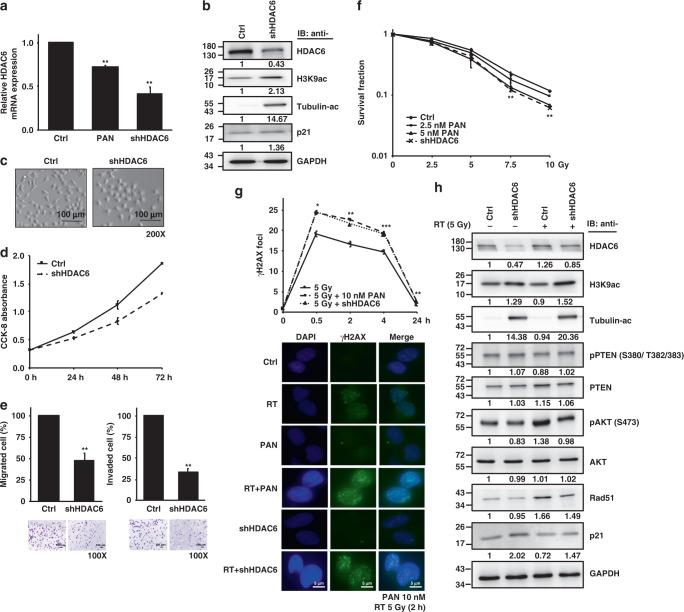
Fig. 2. HDAC6 knockdown increases the radiosensitivity of T24 cells.
a HDAC6 mRNA expression level in T24 cells with (shHDAC6) or without (Ctrl) HDAC6 knockdown as assessed by qPCR. Panobinostat (PAN) treatment was used for comparison. b Western blotting for HDAC6, H3K9ac, acetyl-α-tubulin and p21 expression in control and shHDAC6 T24 cells. GAPDH was used as the internal control. c Cell morphologies of the control and shHDAC6 T24 cells. Scale bar represents 100 μm. d Growth curves of the control and shHDAC6 T24 cells were determined by the CCK-8 assay at 24, 48 and 72 h. e Cell migration and invasion abilities were examined based on the numbers of stained migrated (16 h) and invaded (20 h) cells on the lower Transwell membrane as viewed under a microscope. Representative images of the control and shHDAC6 T24 cells are shown below. f Clonogenic survival of control and shHDAC6 T24 cells. Colonies were stained with 0.25% crystal violet at day 7, and the survival rate was calculated. g Immunofluorescence staining with an anti-γH2AX antibody was performed in control and shHDAC6 T24 cells subjected to RT (5 Gy). The average number of γH2AX foci per cell was analysed at 0.5, 2, 4 and 24 h, and representative images at 2 h are shown below. Data are presented as the means ± SD from three independent biological replicates. Student’s t-test was used for significant differences. *P < 0.05; **P < 0.01; ***P < 0.001. h Western blotting analysis in control and shHDAC6 T24 cells with or without RT (5 Gy) at 16 h.

