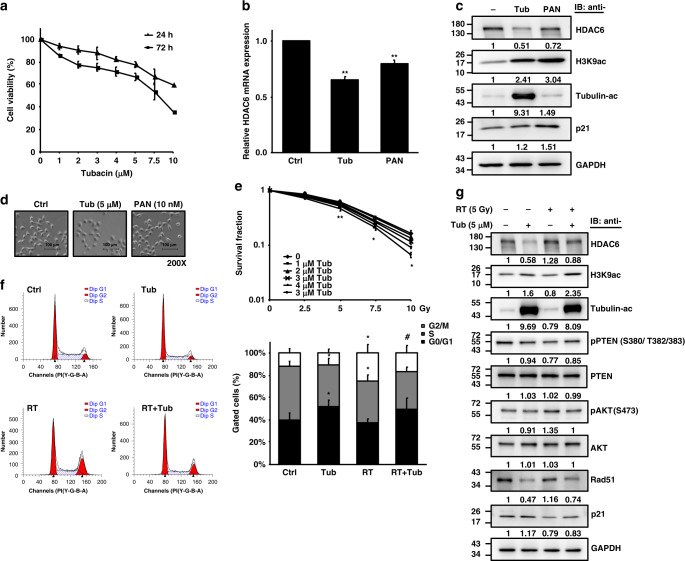
Fig. 3. The radiosensitizing effect of the specific HDAC6 inhibitor tubacin in T24 cells.
a The viability of T24 cells treated with tubacin (µM) was analysed at 24 and 72 h by the CCK-8 assay. b HDAC6 mRNA expression in T24 cells treated with 5 µM tubacin (Tub) was assessed by qPCR. Panobinostat (PAN) treatment was used for comparison. c Western blotting for HDAC6, H3K9ac, acetyl-α-tubulin and p21 expression in T24 cells treated with tubacin or panobinostat for 16 h. GAPDH was used as the internal control. d Cell morphologies of T24 cells treated with tubacin or panobinostat. Scale bar represents 100 µm. e Clonogenic survival of T24 cells treated with tubacin (Tub) followed by irradiation (Gy). Colonies were stained with 0.25% crystal violet at day 7, and the survival rate was calculated. f The cell cycle distribution of T24 cells treated with RT (5 Gy), tubacin (5 µM), and the combination of RT and tubacin (RT + Tub) was analysed at 16 h by flow cytometry. The percentages of cells within G0/G1, S and G2/M phases are shown. Data are presented as the means ± SD from three independent biological replicates. Student’s t-test was used for significant differences. *P < 0.05; **P < 0.01 compared to control. #P < 0.05 compared to RT. g Western blotting analysis for HDAC6, H3K9ac, acetyl-α-tubulin, phospho-PTEN, PTEN, phospho-AKT, AKT, Rad51 and p21 expression in T24 cells treated with RT (5 Gy), tubacin (5 µM), and the combination of RT and tubacin (RT + Tub) at 16 h.

