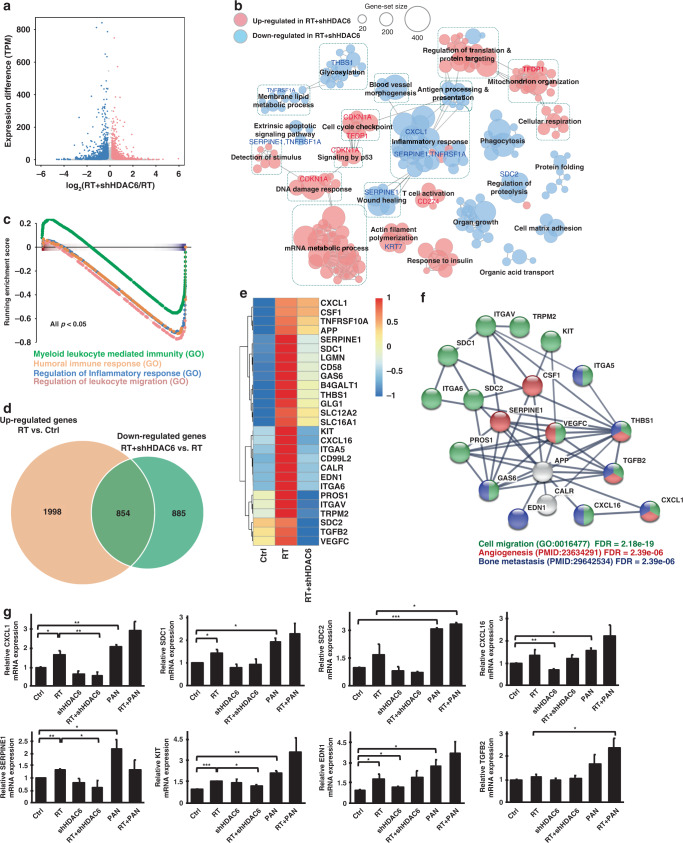
Fig. 4. RNA-seq analysis of shHDAC6 T24 cells reveals that irradiation-induced genes were repressed by HDAC6 knockdown.
a Scatter plot showing the log2 fold change for each gene between T24 cells with HDAC6 knockdown and subjected to radiation (RT + shHDAC6) and T24 cells subjected to radiation alone (RT) versus the differential expression in transcript per million (TPM). The red and blue dots denote the differentially expressed genes (DEGs) that are up- and downregulated, respectively, in RT + shHDAC6 cells compared to RT alone cells with a NOISeq probability >0.4. b Enrichment map of significantly enriched gene sets (FDR < 0.05) in RT + shHDAC6 T24 cells compared to RT alone cells. Nodes represent each gene set, and edges represent the connection of the similar gene sets in the network. Node size indicates the number of genes in the given gene set. c Gene set enrichment analysis (GSEA) of the DEGs in RT + shHDAC6 T24 cells shows enrichment in the inflammatory response. d The Venn diagram shows the overlap between the gene set of upregulated genes in T24 cells treated with RT compared to untreated cells (Ctrl) and the gene set of downregulated genes in RT + shHDAC6 T24 cells compared to RT alone cells. e Heatmap of gene expression from the overlapping gene set shown in d in the control, RT and RT + shHDAC6 T24 cells. f Protein–protein interaction (PPI) analysis of the gene set shown in e. g mRNA levels of CXCL1, SERPINE1, SDC1, KIT, EDN1, SDC2 CXCL16 and TGFB2 were validated by qPCR in control and shHDAC6 T24 cells treated with or without 5 Gy irradiation. 10 nM panobinostat was used for comparison. Data are presented as the means ± SD from three independent biological replicates. Student’s t-test was used for significant differences. *P < 0.05; **P < 0.01; ***P < 0.001.

