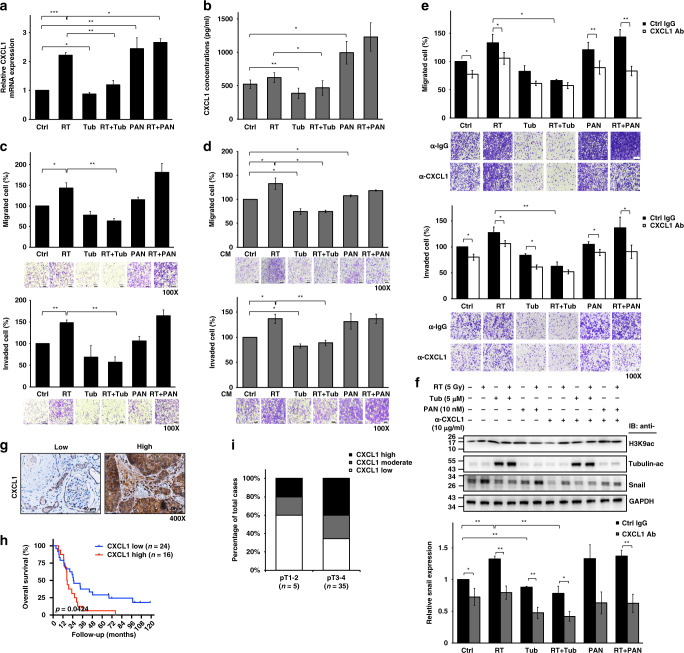
Fig. 5. Tubacin represses RT-induced oncogenic CXCL1 signalling.
a CXCL1 mRNA expression in T24 cells with or without 5 µM tubacin (Tub) treatment followed by 5 Gy irradiation (RT) was assessed by qPCR. Panobinostat (PAN, 10 nM) was used for comparison. b CXCL1 protein levels in conditioned medium from T24 cells with or without 5 µM Tub treatment followed by 5 Gy irradiation were measured by ELISA at 24 h. c Migration and invasion assays of T24 cells with or without 5 µM Tub treatment followed by 5 Gy irradiation. Migrated and invaded cells on the lower Transwell membrane were stained and calculated at 16 and 20 h, respectively. Representative images are shown below individually. d Migration and invasion assays of T24 cells treated with conditioned medium (CM) from cells with or without 5 µM Tub treatment followed by 5 Gy irradiation. Migrated and invaded cells on the lower Transwell membrane were stained and calculated at 16 and 20 h, respectively. Representative images are shown below individually. e Migration and invasion assays of Tub- and RT + Tub-treated T24 cells in the presence of 10 µg/mL anti-CXCL1 or control IgG treatment. Panobinostat (PAN)- and RT + PAN-treated cells were used for comparison. Migrated and invaded cells on the lower Transwell membrane were stained and calculated at 16 and 20 h, respectively. Representative images are shown below individually. f Western blotting for H3K9ac, acetyl-α-tubulin and Snail in Tub- and RT + Tub-treated T24 cells with or without anti-CXCL1 treatment at 24 h. Panobinostat (PAN)- and RT + PAN-treated cells were used for comparison. Snail protein expression was quantified by ImageJ. Data are presented as the means ± SD from three independent biological replicates. Student’s t-test was used for significant differences. *P < 0.05; **P < 0.01; ***P < 0.001. g Immunohistochemical staining for CXCL1 in tumour tissues obtained from urothelial carcinoma patients. Representative images are shown, and brown precipitates indicate positive signals. Scale bar represents 50 µm. h Overall survival analysis of 40 urothelial carcinoma patients categorised by CXCL1 protein levels. Statistical differences were assessed by the log-rank (Mantel–Cox) test. i Categorisation of CXCL1 expression in patients with high (pT3-4) and low (pT1-2) T stages.

