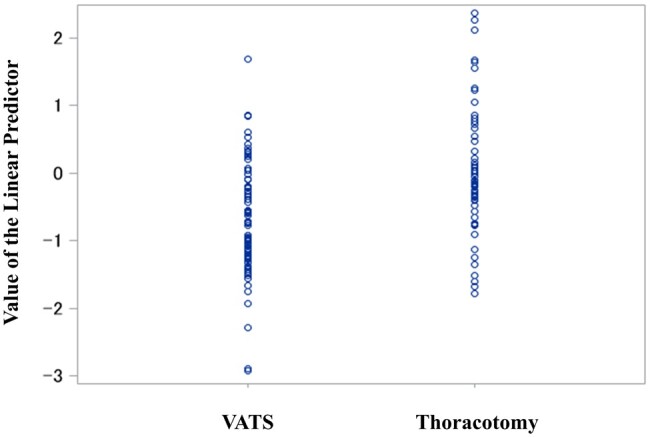
Figure 2:

Logit-transformed propensity score comprised the preoperative characteristics of the VATS and thoracotomy groups. The distributions differed significantly between the VATS (mean: −0.7, SD: 0.81) and thoracotomy (mean: 0, SD: 0.95) groups (P < 0.0001). VATS: video-assisted thoracic surgery; SD: standard deviation.
