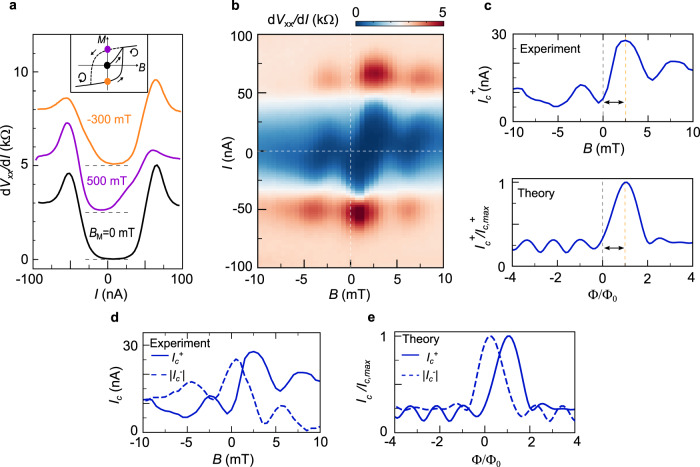
Fig. 3. JJ with orbital magnetism.
a dVxx/dI vs. I measured at B = 0 mT and T = 800 mK right after cooldown (black) and after the sample has been subjected to two opposing pre-magnetizing fields BM. The curves are vertically shifted by 2.5 kΩ each for clarity. The inset shows a schematic of magnetization M vs. B. The colored dots correspond to the magnetic states in which the different dVxx/dI vs. I curves were taken and the arrows describe the direction in which the field is swept. b Fraunhofer pattern with nJ = −1.56 × 1012 cm−2 measured at 800 mK. The white dashed lines mark the 0 current and 0 field positions. c (Top) Positive critical current Ic+ vs. B at 800 mK. The vertical dashed lines remark the shift of the Ic+ maximum from zero field. (Bottom) Theoretical Ic+ vs. magnetic flux (Φ) normalized by the flux quantum (Φ0) calculated for a MATBG JJ with a valley-polarized υ = −2 state as the weak link. The pattern has been shifted by +Φ0 to compare with the experiment. d Experimental Ic+ and |Ic−| vs. B, extracted from b. Reversing the current direction inverts the line-shape of the curve and changes the shift in magnetic field. e Theoretical Ic+ and |Ic−| vs. Φ for a MATBG JJ with a valley-polarized υ = −2 state as the weak link. To compare with the experiment, a shift of +Φ0 and +0.2Φ0 was added to Ic+ and |Ic−|, respectively.

