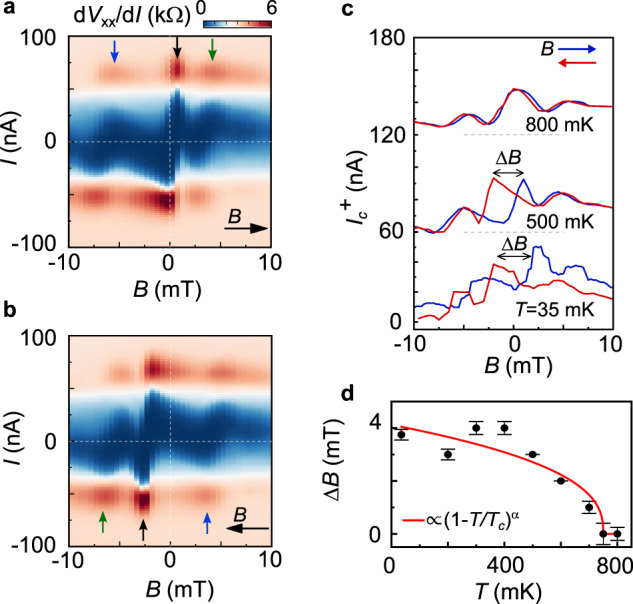
Fig. 4. Evolution of magnetic hysteresis with temperature.

a, b Fraunhofer patterns measured at 500 mK with field sweeping up (a) and down (b) as marked with the black arrows. The white dashed lines mark the 0 current and 0 field positions. The colored arrows highlight a period change in the pattern and the fact that by rotating a by 180° one would get the periodicity of b. c Ic+ extracted from the Fraunhofer patterns with the magnetic field sweeping up (blue) and down (red) at 800, 500, and 35 mK. The curves are vertically shifted by 60 nA each for clarity. d Extracted ΔB vs. temperature T for Ic+. The red curve is a fit to the Curie–Bloch equation (1–T/Tc)α with fitting parameters Tc ~750 ± 25 mK and α ~0.4 ± 0.05. The error bars are defined as the standard deviation of the extracted Ic values as explained in the SI.
