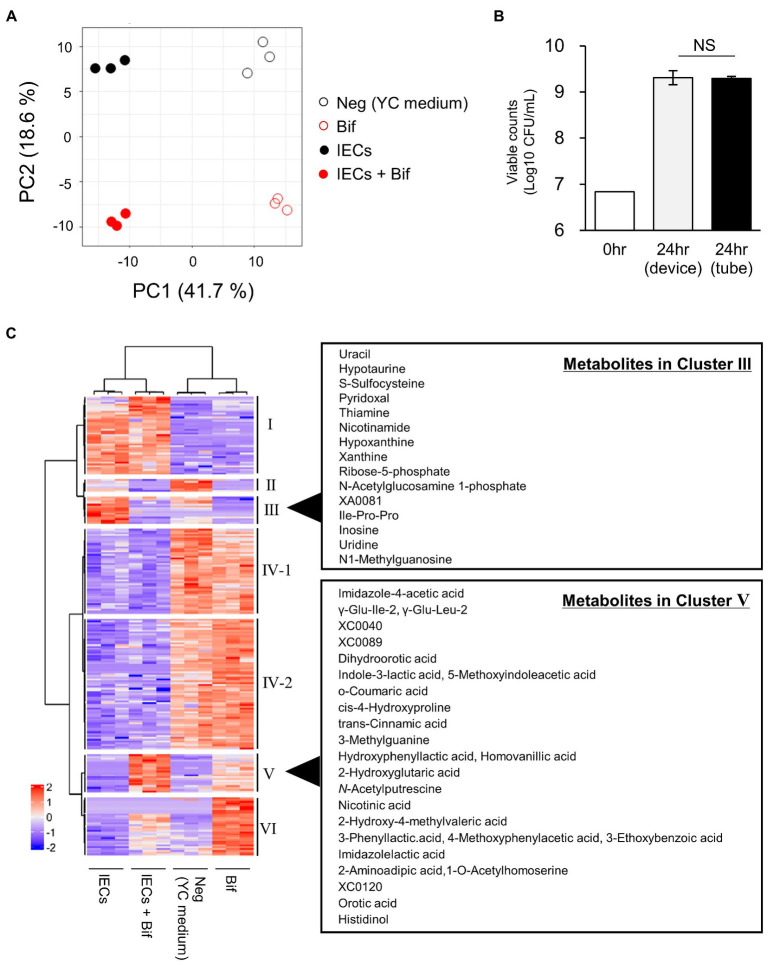
Figure 1.
Comparison of the metabolites in the culture supernatants of Bifidobacterium breve MCC1274 with or without IECs. (A) PCA plot based on the total metabolites detected in the apical side of the device. Neg, YC medium; Bif, supernatant of B. breve MCC1274 monocultured for 24 h in tube. IECs, supernatant of IECs monocultured in the apical side of the co-culture device cultured for 48 h; IECs + Bif, supernatant of IECs co-cultured with B. breve MCC1274 in the apical side of the co-culture device cultured for 24 h. (B) Viable cell count of B. breve MCC1274 before (0 h) and after (24 h) cultivation in the tube as a monoculture, and in the device as a co-culture with IECs. The data represent the average of two samples (0 h) and six samples (24 h) from each group, from two independent experiments (Average ± standard deviation). Standard deviation were not described in before cultivation samples. NS, not significant (p = 0.83, Welch’s t-test). (C) A heatmap of the scaled intensity value of each metabolite with a significant difference (q-value <0.1) in the Kruskal–Wallis and Benjamini–Hochberg tests.

