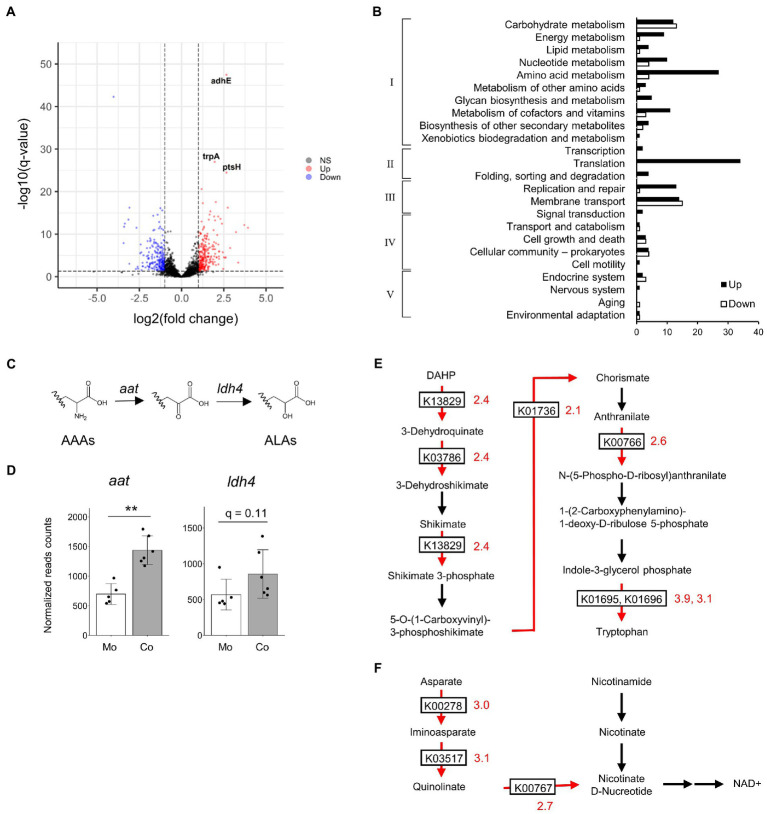
Figure 4.
Comparison of gene expression profiles of B. breve MCC1274 in monoculture and in co-culture with IECs. (A) Volcano plot of total gene expression. Vertical and horizontal dotted lines indicate the fold-change value |FC| = 2 and a q-value of 0.05, respectively. Upregulated DEGs in the co-culture conditions are labeled in red, while downregulated DEGs are labeled in blue. RNA-seq was performed on five to six samples from two independent experiments. (B) KEGG Orthology (KO) functional classification of annotated DEGs. The horizontal axis represents the number of genes. Categories I–V represent the following mapped KEGG pathway categories: I, Metabolism; II, Genetic Information Processing; III, Environmental Information Processing; IV, Cellular Processes; V, Organismal Systems. (C) Aromatic amino acid synthesis pathway. (D) The normalized read counts from RNA-seq analysis. Mo, B. breve MCC1274 monocultured in the tube; Co, B. breve MCC1274 co-cultured with IECs. **q < 0.01 (Deseq2). (E,F) Tryptophan synthesis pathway components: (E) NADH synthesis (F) The red arrow indicates the enzymes whose gene expression was upregulated in co-culture (fold change >2, q-value <0.05). Black arrows indicate gene expression that was not significantly changed. The numbers next to the boxes describing KEGG Orthology indicate fold change. AAAs, aromatic amino acids; ALAs, aromatic lactic acids; APAs, aromatic pyruvic acids; DHAP, 2-Dehydro-3-deoxy-D-arabino-heptonate 7-phosphate.

