Figure 2.
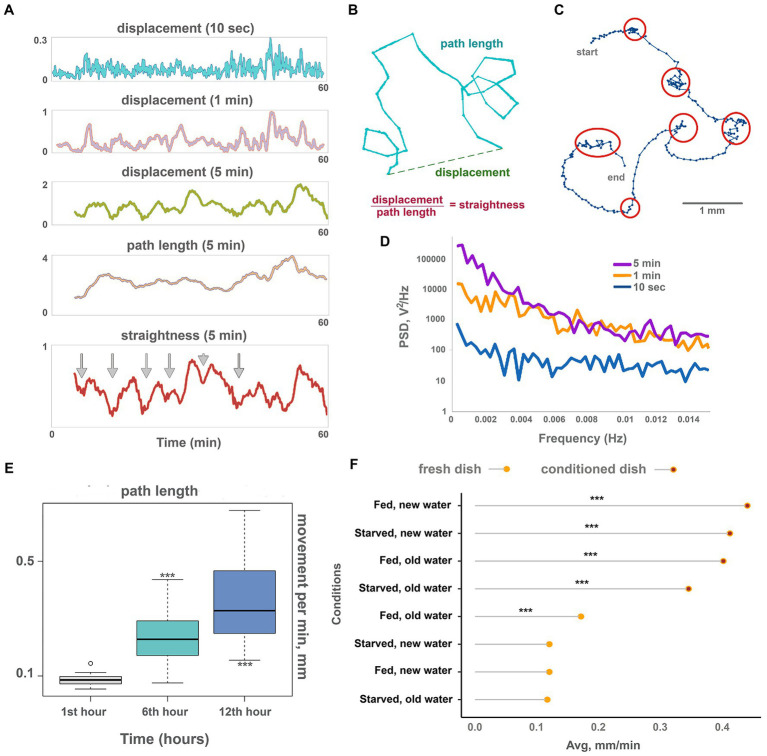
Oscillations and long-term dynamics during normal locomotion. (A) The plot of displacements (how far out of starting place an animal is located) of a single animal for 10 s, 1 min, and 5 min periods, plus track length and track straightness (displacement/length ratio) for 5 min periods observed for 60 min on conditioned Petri dish. While 10-s displacements are chaotic, oscillations emerge in 1 min and are clearly observed in 5 min displacements. Larger scale oscillations of 5 min displacement with a period of about 6–8 min coincide with fluctuations of path straightness. The path length is more stable over time and does not show regular oscillations. Arrows denote chaotic “marking time” periods every 6–8 min when track straightness is reduced. (B) Scheme showing displacement (how far out of an animal’s starting position), path length, and straightness. (C) Track of the Trichoplax with dots marking an animal’s positions every 10 s, recorded for 40 min—it is the same specimen as in A. Six periods of decreased locomotory speed (dense dots) are highlighted with red circles and correspond to straightness minima marked by arrows in A. Note that periods of decreased speed coincide with sharp turns of the track. See also Supplementary Videos S3. Animal size is about 0.5 mm. (D) Plot of power spectral density (PSD) of 10 s, 1 min, and 5 min displacements on conditioned Petri dish (average of 10 animals). PSD of 10-s displacements is nearly uniform (characteristic of white noise), while PSD of 1 min and especially 5 min displacements show pronounced low-frequency fluctuations (below 0.004 Hz, or periods above 250 s). (E) The speed of locomotion of the Trichoplax is gradually accelerated over 12 h. Animal locomotion and tracks were recorded at 60-min intervals. Asterisks denote significant differences in the locomotion speed from initial observations during the 1st hour (Welch t-test, ***p < 0.001) N animals = 20. (F) Factors affecting the long-term acceleration of Trichoplax adhaerens on glass dish: animal starvation, water, and glass freshness. Data are presented as median ± SD. N = 33, 36, 37, 34, 32, 35, 33, 35. Locomotion is slow on a fresh glass dish and accelerated on the conditioned (“old”) glass where placozoans (same or another specimen) crawled for 24 h before. The speed of locomotion was recorded for 120 min. Asterisks denote a significant difference in speed from the control condition (new dish, new water, well-fed animals; Welch t-test, ***p < 0.001).

