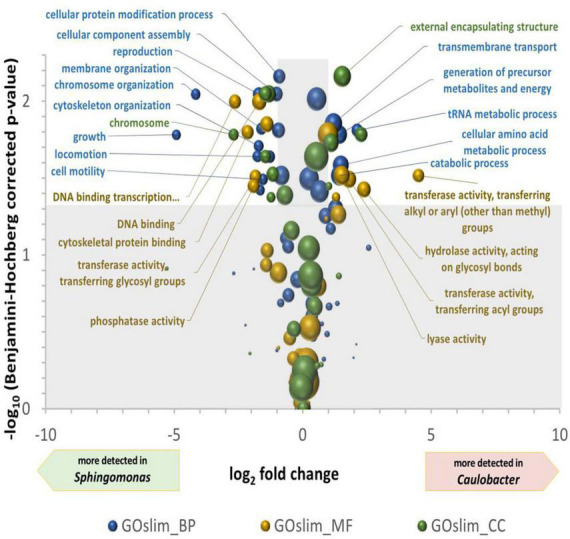
FIGURE 4.

Volcano plot of the differential detection of GOslim terms between Caulobacter and Sphingomonas. The X-axis is the ln2 of the quantification of GOslim terms associated to Caulobacter divided by their quantification associated to Sphingomonas. The Y-axis is the -log10 of bilateral T-test p-values, after Benjamini–Hochberg multiple tests correction, comparing the four quantifications of Caulobacter and Sphingomonas GOslim terms in the four wall scrubs. The areas of the spheres are proportional to the defined quantification of the Caulobacter and Sphingomonas GOslim terms. Significantly different GO terms between genera are found in the unshaded area, i.e., with more than two-fold modulation and a –log (p-value) greater than 1.3.
