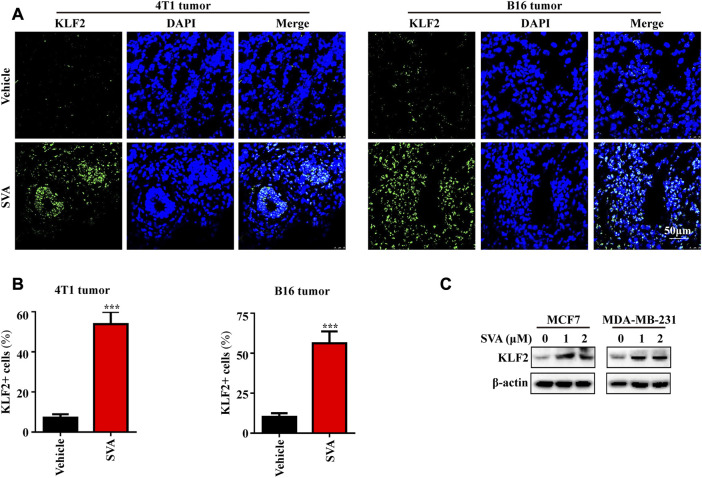
FIGURE 9.
The induction of KLF2 expression by Simvastatin. (A, B) Immunofluorescence analysis of KLF2 was conducted on 4T1 tumors and B16 tumors from the vehicle and 15 mg/kg/day SVA groups. Bar = 50 μm. (C) To examine KLF2 expression in MCF7 and MDA-MB-231 cells after treatment with 0, 1 and 2 μM SVA by western blotting. ∗, p < 0.05; ∗∗, p < 0.01; ∗∗∗, p < 0.001; ns, no significant.

