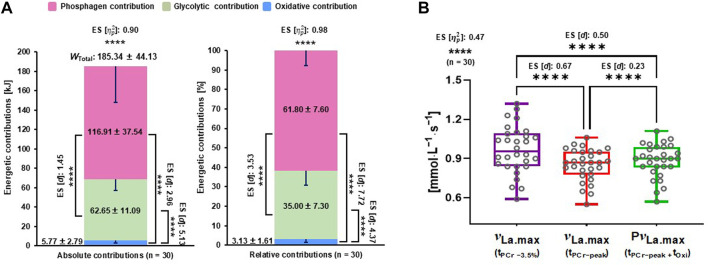
FIGURE 2.
Energetic contributions and different calculations of ν La.max. (A) Comparisons of three energy contributions in kilojoules and percentage, and (B) comparisons of three different ν La.max calculations. ES, effect sizes; ν La.max, maximal rate of lactate accumulation; P ν La.max, pure maximal rate of lactate accumulation; tOxi, time of oxidative energy system contribution; tPCr−peak, phosphagen energy system–contributed time until the peak power output; tPCr −3.5%, phosphagen energy system contributed −3.5% time point from the peak power output; W Total, total energy demand. Significant difference; ****p < .0001.

