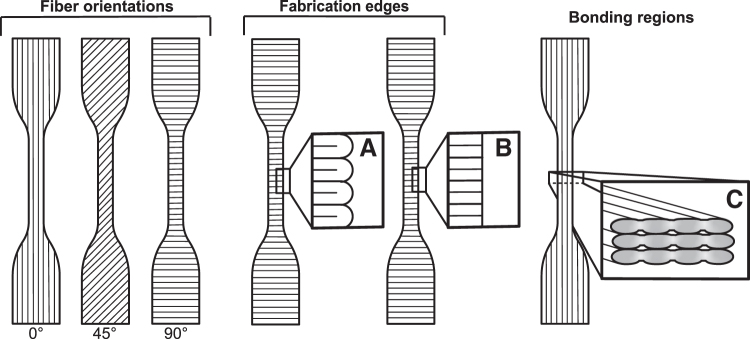
FIG. 2.
Raster-printed dogbone schematic showing fiber orientations. Insets: (A) raster-printed edge showing continuous loops at the edge of the sample, (B) punched edge showing no loops, and (C) sample cross-section showing the fiber bonding regions. For (A/B) and (C), 0° and 90° samples are used for illustrative purposes, but the edge effects and bonding regions shown are relevant to all fiber orientations.

