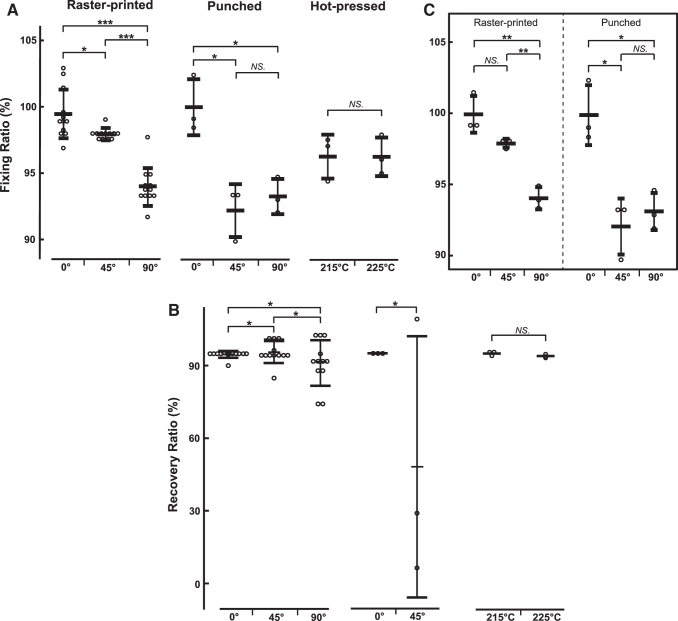
FIG. 4.
(A) Fiber orientation affects fixing ratio in both raster-printed and punched samples. Crossbars on standard deviations show group means (*p < 0.05; ***p < 0.001, Tukey's HSD post hoc). No significant effects were found for the hot-pressed control groups. (B) Fiber orientation significantly affects the variance of recovery ratio of both raster-printed and punched samples. Crossbars on standard deviations show group means (*p < 0.050 by Bartlett's test for raster-printed samples and F-test for punched samples). No significant effects were found for the hot-pressed control groups. (C) For only the subset of samples from (A) printed at 225°C with a multiplier of 1.0, interactions between fiber orientation and fabrication method have a significant effect on fixing ratio. Crossbars on standard deviations show group means (*p < 0.05; **p < 0.005; NS p > 0.05, Tukey's HSD post hoc). For the polynomial regressions (raster-printed sample fixing and recovery ratios) and piecewise linear regression (punched sample fixing ratio), θ is in units of degrees. HSD, Tukey's honestly significant difference test; NS, no significant difference.

