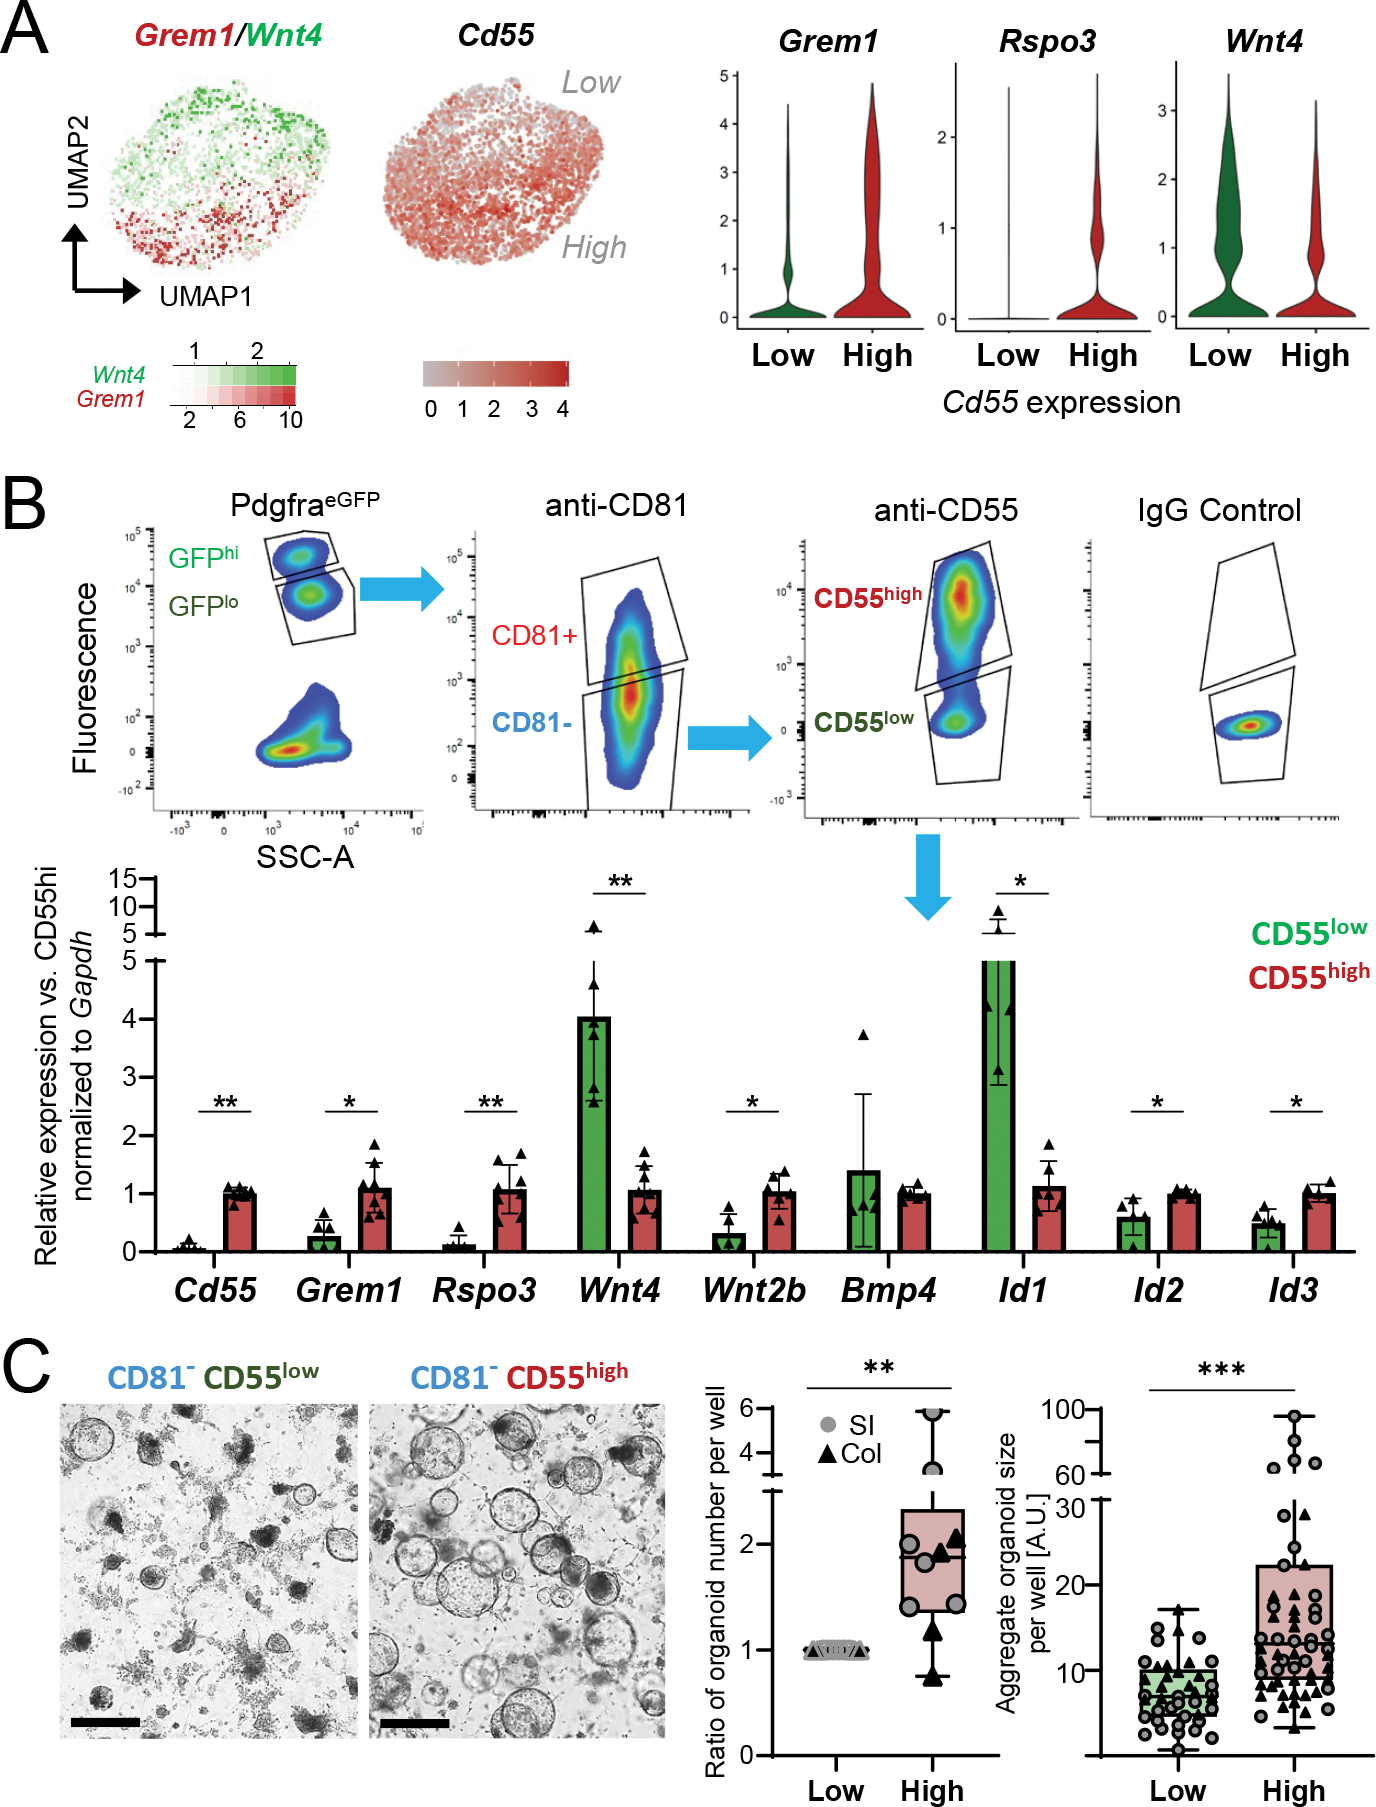
Figure 5. Functional distinction of heterogenous CD81− stromal cells.

A) Left, Grem1 (red) and Wnt4 (green) expression overlay and Cd55 levels in single Cd81− stromal cells aggregated from independent collections, as in Figure 3D. Right, marker expression in scRNA-seq data in cells separated in silico for high (SCT-transformed counts >1, n= 1,756 cells) or low (n=2,322 cells) Cd55 expression.
B) Top, representative side-scatter area (SSC-A) and fluorescence plots from FACS isolation of PDGFRAlo (based on native PdgfraeGFP signal) CD81− (fluorophore-conjugated 2nd Ab) cells with high or low surface CD55 expression (conjugated Ab, FACS gating with IgG isotype control). Below, qRT-PCR for selected mRNAs in primary colonic PDGFRAlo CD81− stromal cells sorted for low (green) or high (red) surface CD55. mRNA expression is normalized to Gapdh and displayed relative to average expression in CD55hi cells (ΔΔCt). Bars: Mean ±SD from n=5–8 independent cell isolations.
C) Organoids from duodenal crypts co-cultured with CD55lo or CD55hi cells without added growth factors 4 days after seeding at 10,000 stromal cells/10 μl Matrigel droplet; brightfield images, scale bars 200 μm. Left graph shows fold-difference of average organoid number per well 4 days after the start of co-culture with CD55hi cells, relative to CD55lo cell co-culture (=1). Each point represents the organoid count (average of biological replicates) from each independent experiment with stromal cells from SI (circles, n=6 experiments) or colon (triangles, n=4 experiments). Two-tailed Wilcoxon matched-pairs signed rank test, **Padj 0.006. Right graph shows the sum of all organoid diameters per well in arbitrary units (A.U.) from the same experiments. Box: 25th-75th percentile with median, whiskers: minimum to maximum values. Two-tailed Mann-Whitney test, **Padj <0.001.
