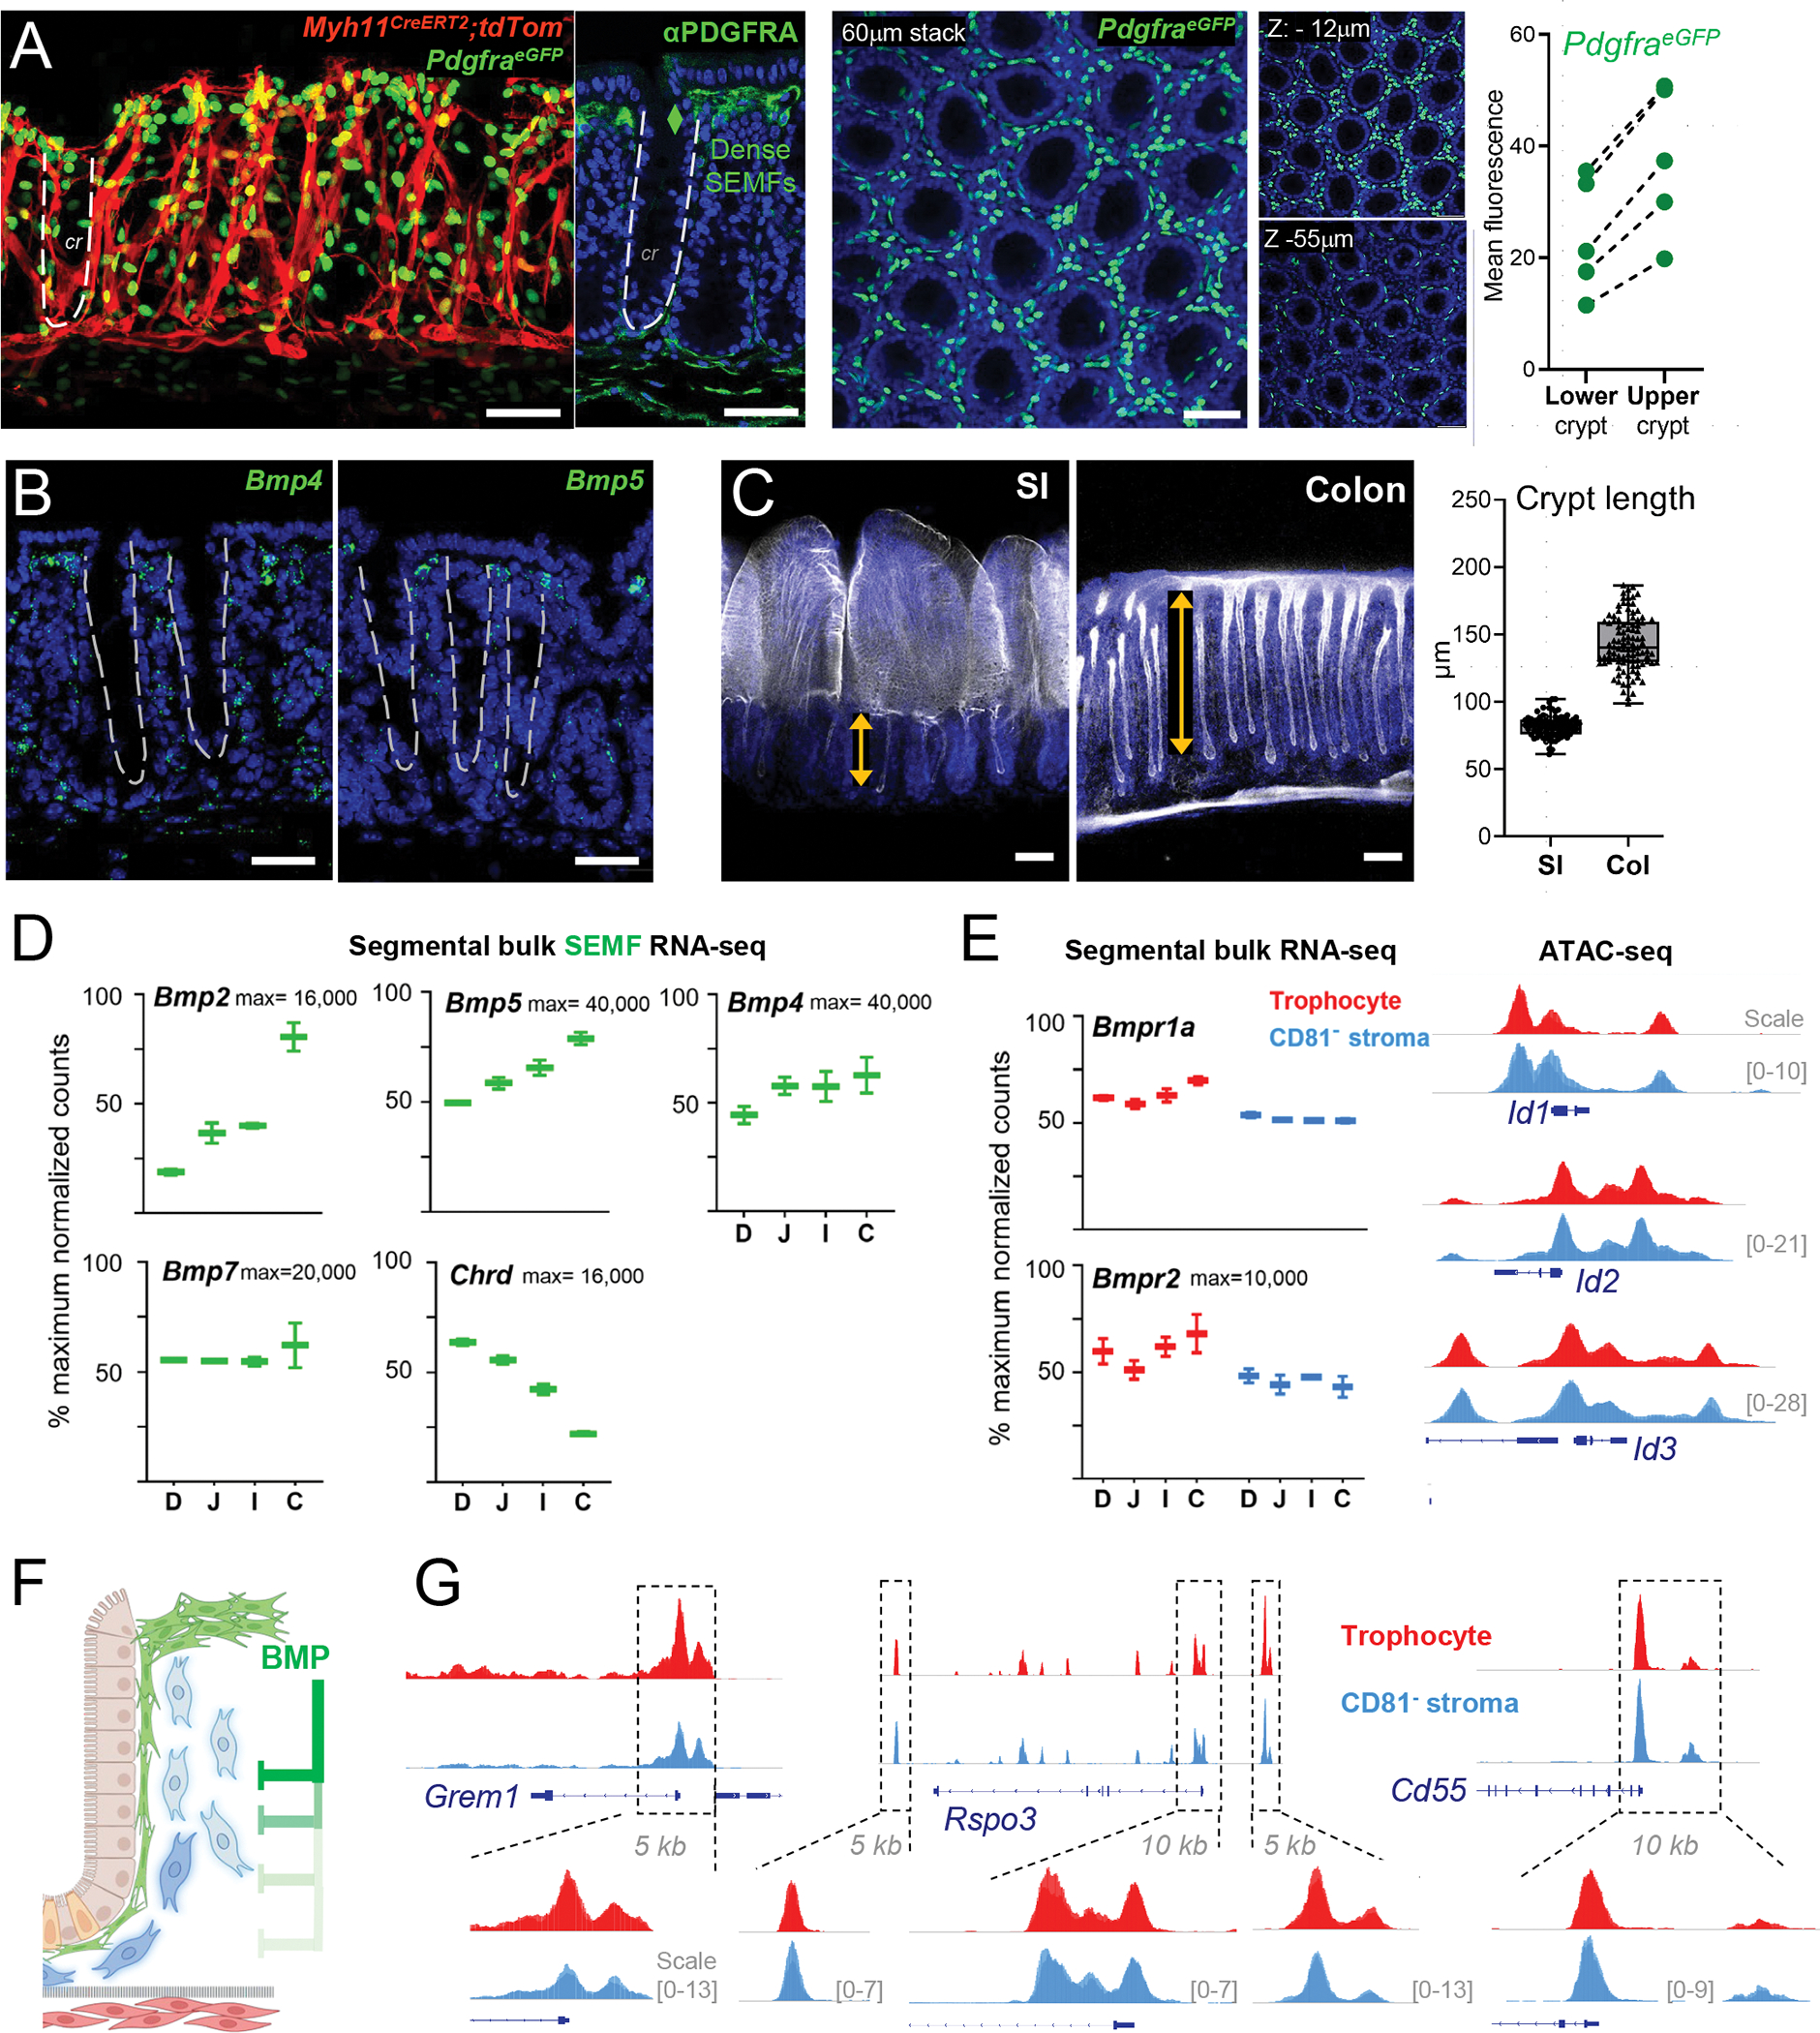
Figure 6. BMPs as candidates for intra-mesenchymal signaling in crypt niche zonation.

A) Left: Myh11CreERT2;R26RtdTom;PdgfraeGFP mouse colon showing SEMF (PDGFRAhi cells, 60 μm stack, en face view) distribution along the crypt length demarcated by tdTom+ myocytes. Adjacent image shows a z-slice of the same tissue stained with PDGFRA Ab (green) and DAPI (nuclei, blue); the dashed line demarcates one crypt. Center, Whole-mount confocal microscopy of colonic PdgfraeGFP crypts counterstained with DAPI (blue). A 60-μm stack is shown with 6-μm sub-stacks at z= −9 to −15 μm (top) and z= −52 to −58 μm (below) shown alongside. Right, eGFP signals were quantified in crypt upper and lower halves as mean fluorescence values in cross-sections of whole-mount images (5 images each from n=3 mice); lines connect paired values from each image. All scale bars 50 μm.
B) In situ hybridization (RNAscope, green) for Bmp4 and Bmp5 in adult mouse colon sections co-stained with DAPI (blue). Dashed lines demarcate crypts. Scale bars 50 μm.
C) Whole-mount confocal images of SI and colon after stripping external smooth muscle layers and staining with phalloidin (F-actin, white) and DAPI (blue). SI: single whole-mount micrograph, colon: 60-μm z-stack. Double arrows outline crypt heights and the graph depicts the heights of ≥200 crypts measured on tissue sections from n=3 wild-type adult mice stained with hematoxylin and eosin (see Figure S7D).
D) Normalized bulk RNA-seq counts for BMP ligands and the BMPi Chordin (Chrd) in SEMFs from each intestinal segment: duodenum (D), jejunum (J), ileum (I), and colon (C) from n=2 mice. Y-axis: percent of maximum normalized read counts (as indicated) for each gene. Box: 25th- 75th percentile, whiskers: minimum to maximum values.
E) Left, normalized bulk RNA-seq counts of BMP receptors 1a and 2 (Bmpr1a and Bmpr2) in SI and colonic trophocytes and CD81− stromal cells (both max=10,000 read counts). Bmpr1b mRNA was not detected. Right, IGV tracks of open chromatin (ATAC-seq signals overlaid from duplicate SI samples) at BMP-responsive loci Id1, Id2, and Id3 (10-kb regions, y-axis scales as indicated).
F) Schema of the hypothesis that BMPs from SEMF aggregates at crypt tops restrain the niche properties of PDGFRAlo cells. BMP-mediated gene suppression is relieved with increasing distance from those aggregates, allowing PDGFRAlo cells toward the crypt bottom to express niche factors and functions.
G) IGV tracks (ATAC-seq signal overlay from duplicate samples) from PDGFRAlo mesenchymal cells at the Grem1, Rspo3, and Cd55 loci. Boxed 5–10 kb regions are magnified to highlight trophocyte and CD81− stromal cell similarities. Y-axis scales are indicated.
See also Figure S7.
