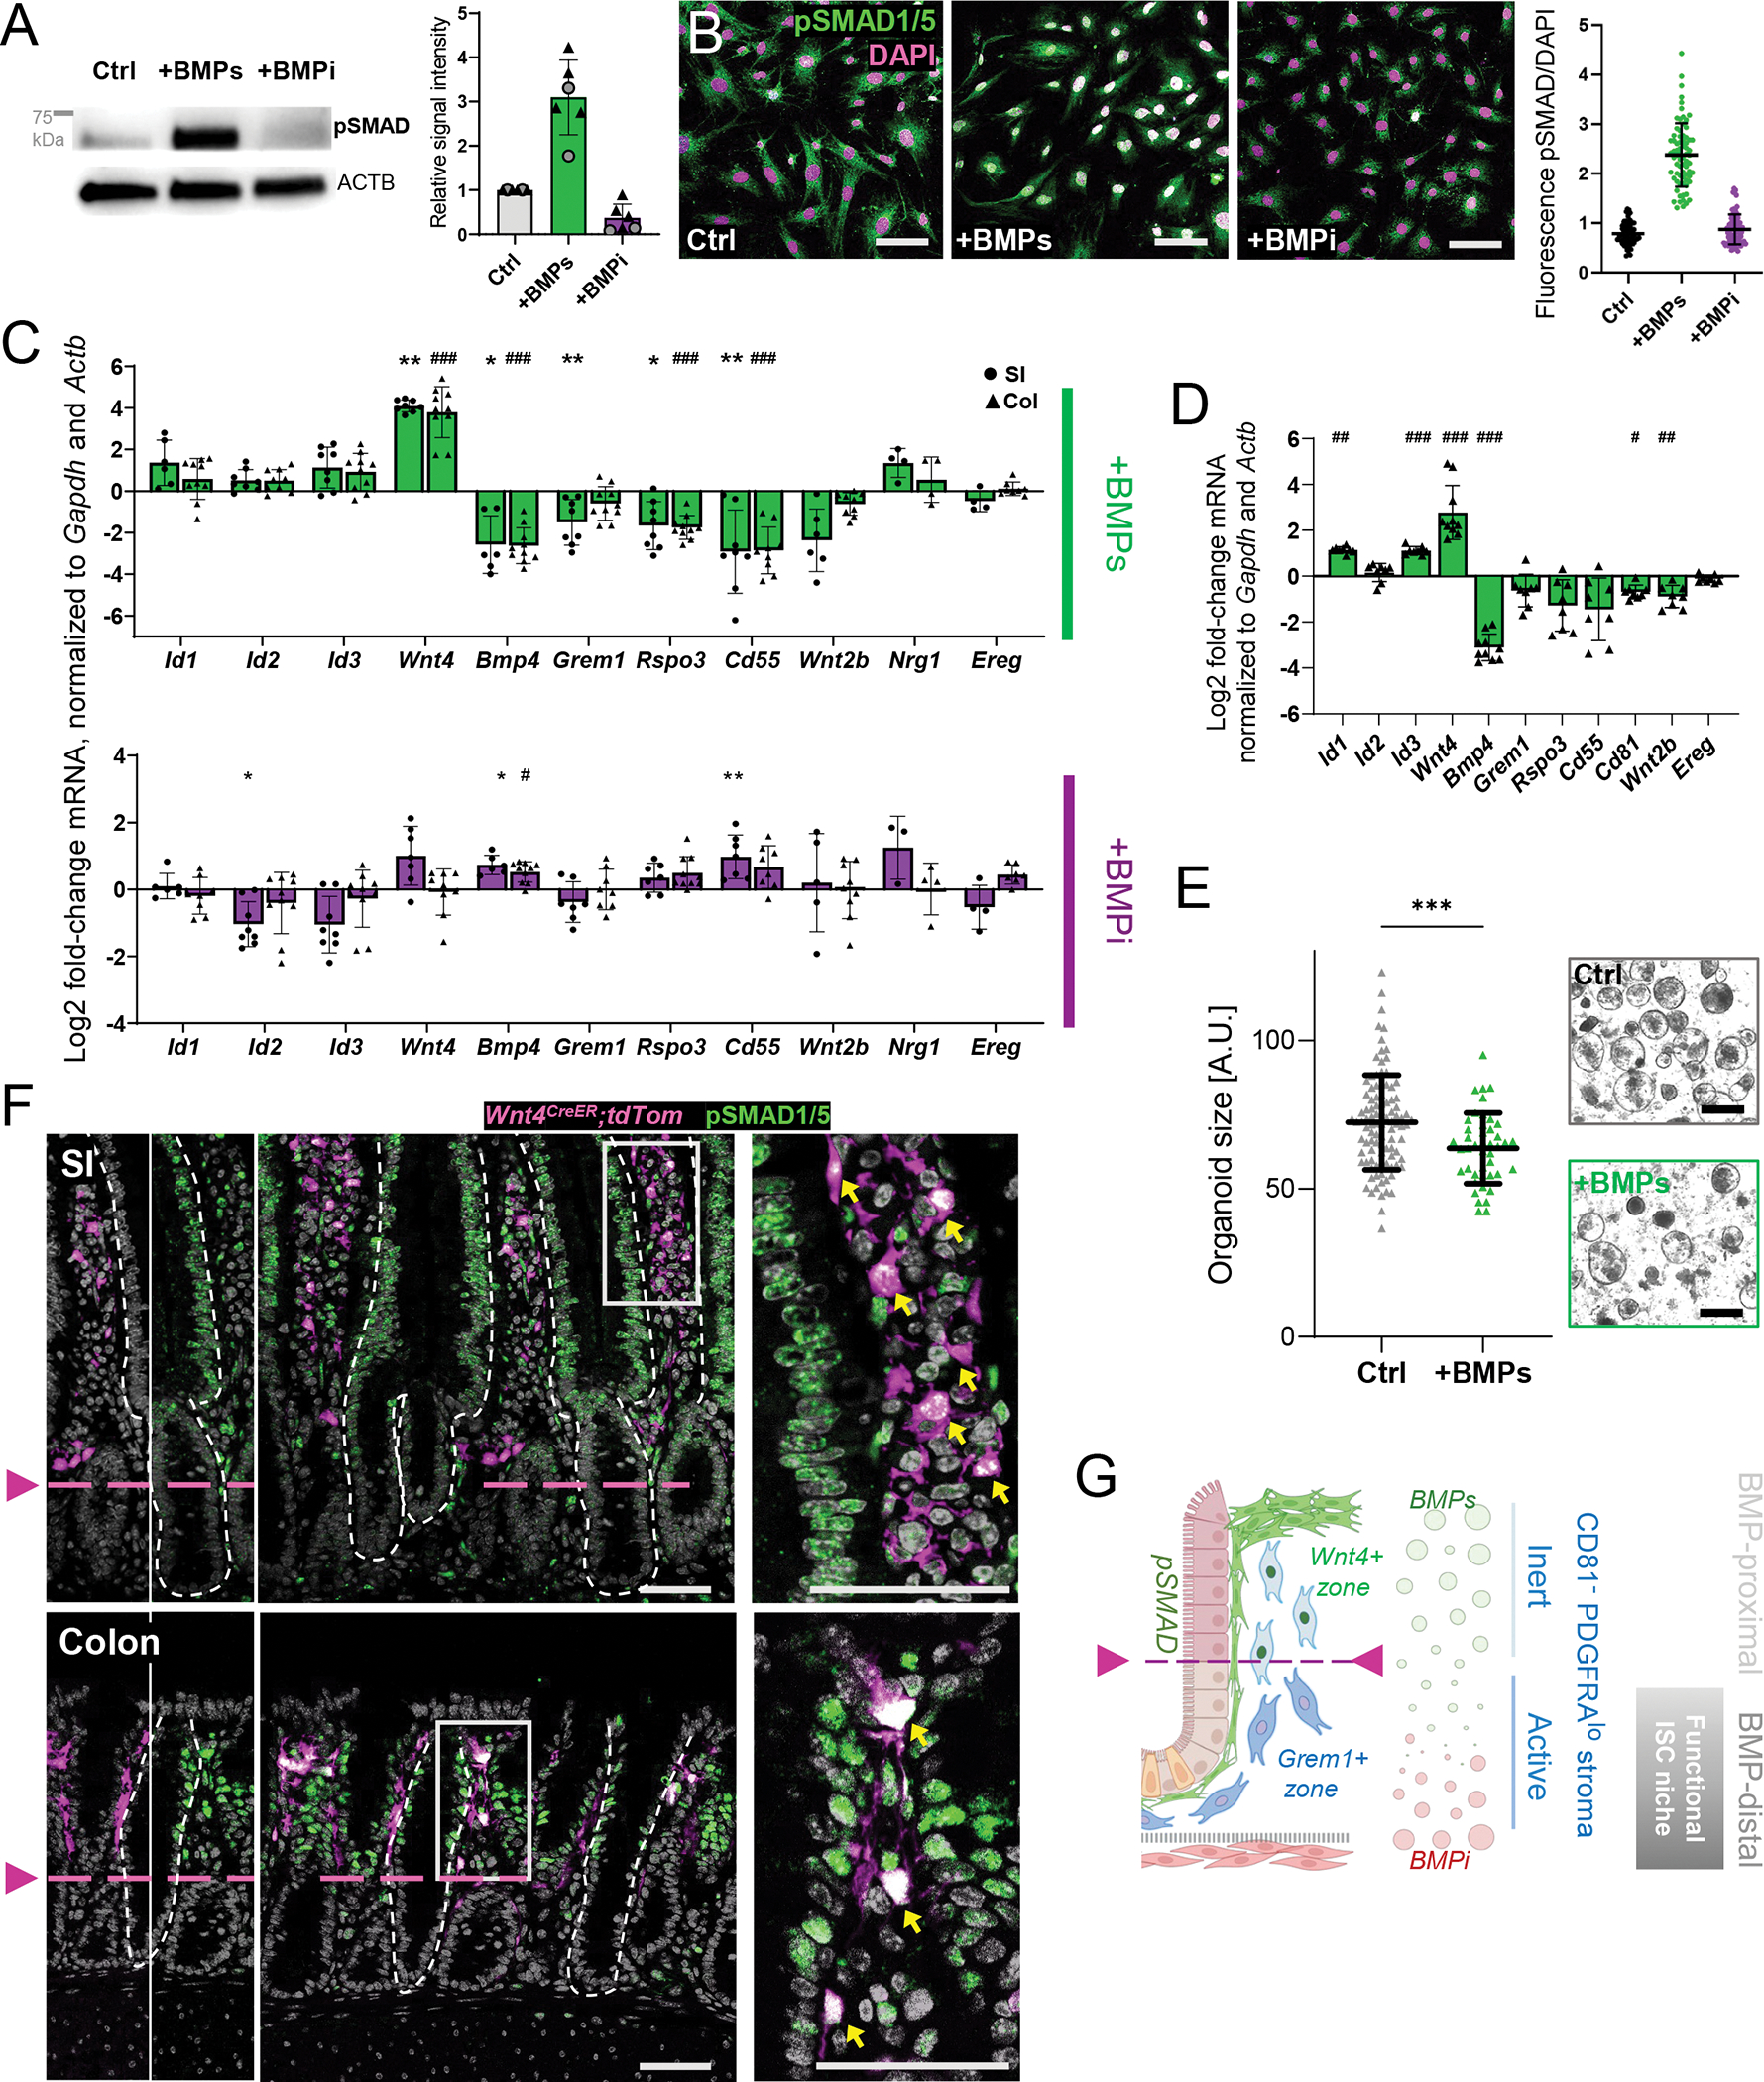
Figure 7. BMP-responsive gene regulation in CD81− stromal cells.

A) Phospho-SMAD1/5 and ACTB (loading control of the same lane) immunoblots from cultured PDGFRAlo CD81− CD55hi stromal cells treated for 5 days with rBMP2/4/7 (100 ng/mL each, combined) or BMPi (rGREM1 and rNOG, 100 ng/mL each, combined) in serum-free medium. The position of a 75-kDa size marker is indicated. Graph: pSMAD1/5 chemiluminescence signals quantified relative to ACTB in SI (circles) or colonic (triangles) cells with respect to untreated cells (Ctrl). Bars represent the Mean±SD from n=6 independent blots.
B) pSMAD1/5 immunofluorescence (green) in cultured PDGFRAlo CD81− CD55hi stromal cells after treatment with rBMPs or rBMPi. Scale bars 100 μm. Representative images from n=4 independent cell isolations and experiments. Graph: nuclear pSMAD fluorescence intensity normalized to DAPI signals. Each dot represents one cell. Lines= Mean ±SD.
C) qRT-PCR assessment of selected transcripts after treatment of primary SI (circles) and colonic (triangles) PDGFRAlo CD81− CD55hi stromal cells for 5 days with rBMPs (top) or rBMPi (bottom) in serum-free media. Expression was normalized to Gapdh and Actb RNA levels. Results are represented as log2 fold-change of normalized expression compared to control cultures of the same region (ΔΔCt). Bar graphs: Mean ±SD of individual samples, derived from n=4 (SI) or n=5 (colon) experiments with 1–2 biological replicates per experiment. Two-tailed Mann-Whitney test with Holm-Sidak correction, SI: Padj <0.05 (*), Padj <0.01 (**), colon: Padj <0.05 (#), Padj <0.01 (##), Padj <0.001 (###).
D) qRT-PCR data for colonic trophocytes cultured and treated as in Figure 7C. Bar graphs: Mean ±SD of individual samples, derived from n=4 experiments with 2 biological replicates per experiment. Two-tailed Mann-Whitney test with Holm-Sidak correction, Padj <0.05 (#), Padj <0.01 (##), Padj <0.001 (###).
E) Organoid size 4 days after SI crypts were co-cultured with PDGFRAlo CD81− CD55hi stromal cells (10,000 cells/10 μl Matrigel) pre-treated for 5 days with rBMP2/4/7 (+BMPs) or untreated (Ctrl, serum-free medium only). Values are in arbitrary units (A.U.) and lines indicate mean±SD. Data are collated from n=3 independent experiments (1–3 biological replicates in each; the individual experiments are shown in Figure S7E) and each value represents one organoid. Unpaired t-test with Welch-correction Padj=0.0004 (***).
F) pSMAD1/5 immunofluorescence (green) and native tdTom signal (magenta) in Wnt4eGFP-CreERT2);R26RtdTom mouse SI (top) and colon (bottom). Left, Single-color view of overlay image in the center. Arrowheads and dashed magenta lines indicate the lower pSMAD/Wnt4 expression boundary. Dashed white lines demarcate epithelium from mesenchyme. Right, magnified insets of boxed areas, with yellow arrows pointing to pSMAD+ (nuclear signal) Wnt4+ (cytoplasmic signal) stromal cells. Scale bars 50 μm.
G) Model for BMP signaling, with supra-cryptal SEMFs providing BMP ligands that are opposed by sub-cryptal BMPi sources, as one basis for heterogenous PDGFRAlo stromal cell states and consequent self-organization of the ISC niche.
See also Figure S7.
